9 years ago
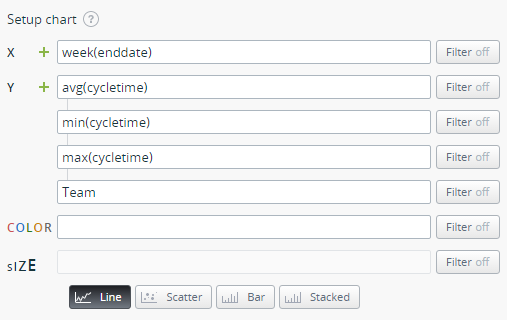
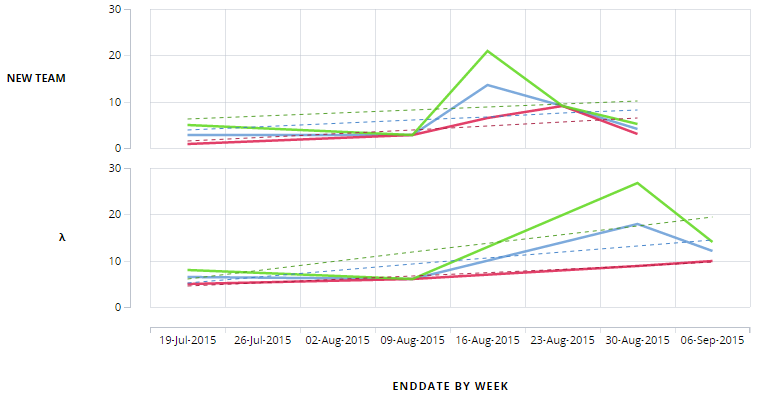
Custom Graphical Reports Improvements - Parallel Data
Starting from v.3.7.8 you can add several data plots to the same axis and see them at the same time.
For example, you want see the average, minimum and maximum Cycle Time trends for your user stories, grouped by Team
Fixed Bugs
- Top settings menu: "Report Issue" renamed to "Email Support"
- Fixed top Project/Team selector to show programs with 0 dependent projects
- Fixed problem with board setup not opening after refreshing the page
- Fixed quick add popup auto closing in the list view
- Fixed error when adding a test case in a No User Story cell on a board with user stories as lanes and test cases as cards
- Burn Down Charts fixed to show independent Features and Epics effort
- Fixed descriptions with CK editor to work in Internet Explorer 10
- Fixed left menu to preserve group expansion state on a page reload
- Fixed corrupted emoji in descriptions and comments
- Fixed SSO settings edit
- Fixed quick add on double click in a lane
- Fixed plugin profile deletion
- Fixed unable to plan Projects from the Timeline view
- Fixed error on a try to add quickly an entity with a 'No team' on a Board with Team/Team State axes
- Fixed XS card zoom level on a Timeline to show unit title for allocations
Add comment