4 years ago
Batch selection of rows in Lists
To optimize work with multiple items, we have added the ability to batch select rows in the list view, or the list inside the detailed view of the card, via Shift+click:
To clean a selection, click ESC on your keyboard.
New Settings for Roles in Assignments
We refactored the way Roles appear for entities. You can now assign roles to entities without that role having to be responsible for any status in the workflow.
To set up Roles, navigate to the new section in the process set up area called "Roles" that is under each process. This allows you to see each role in the process workflow and the entity names under it. It also provides the option to add or remove entities.
More information: How to add and remove Roles in Assignments?
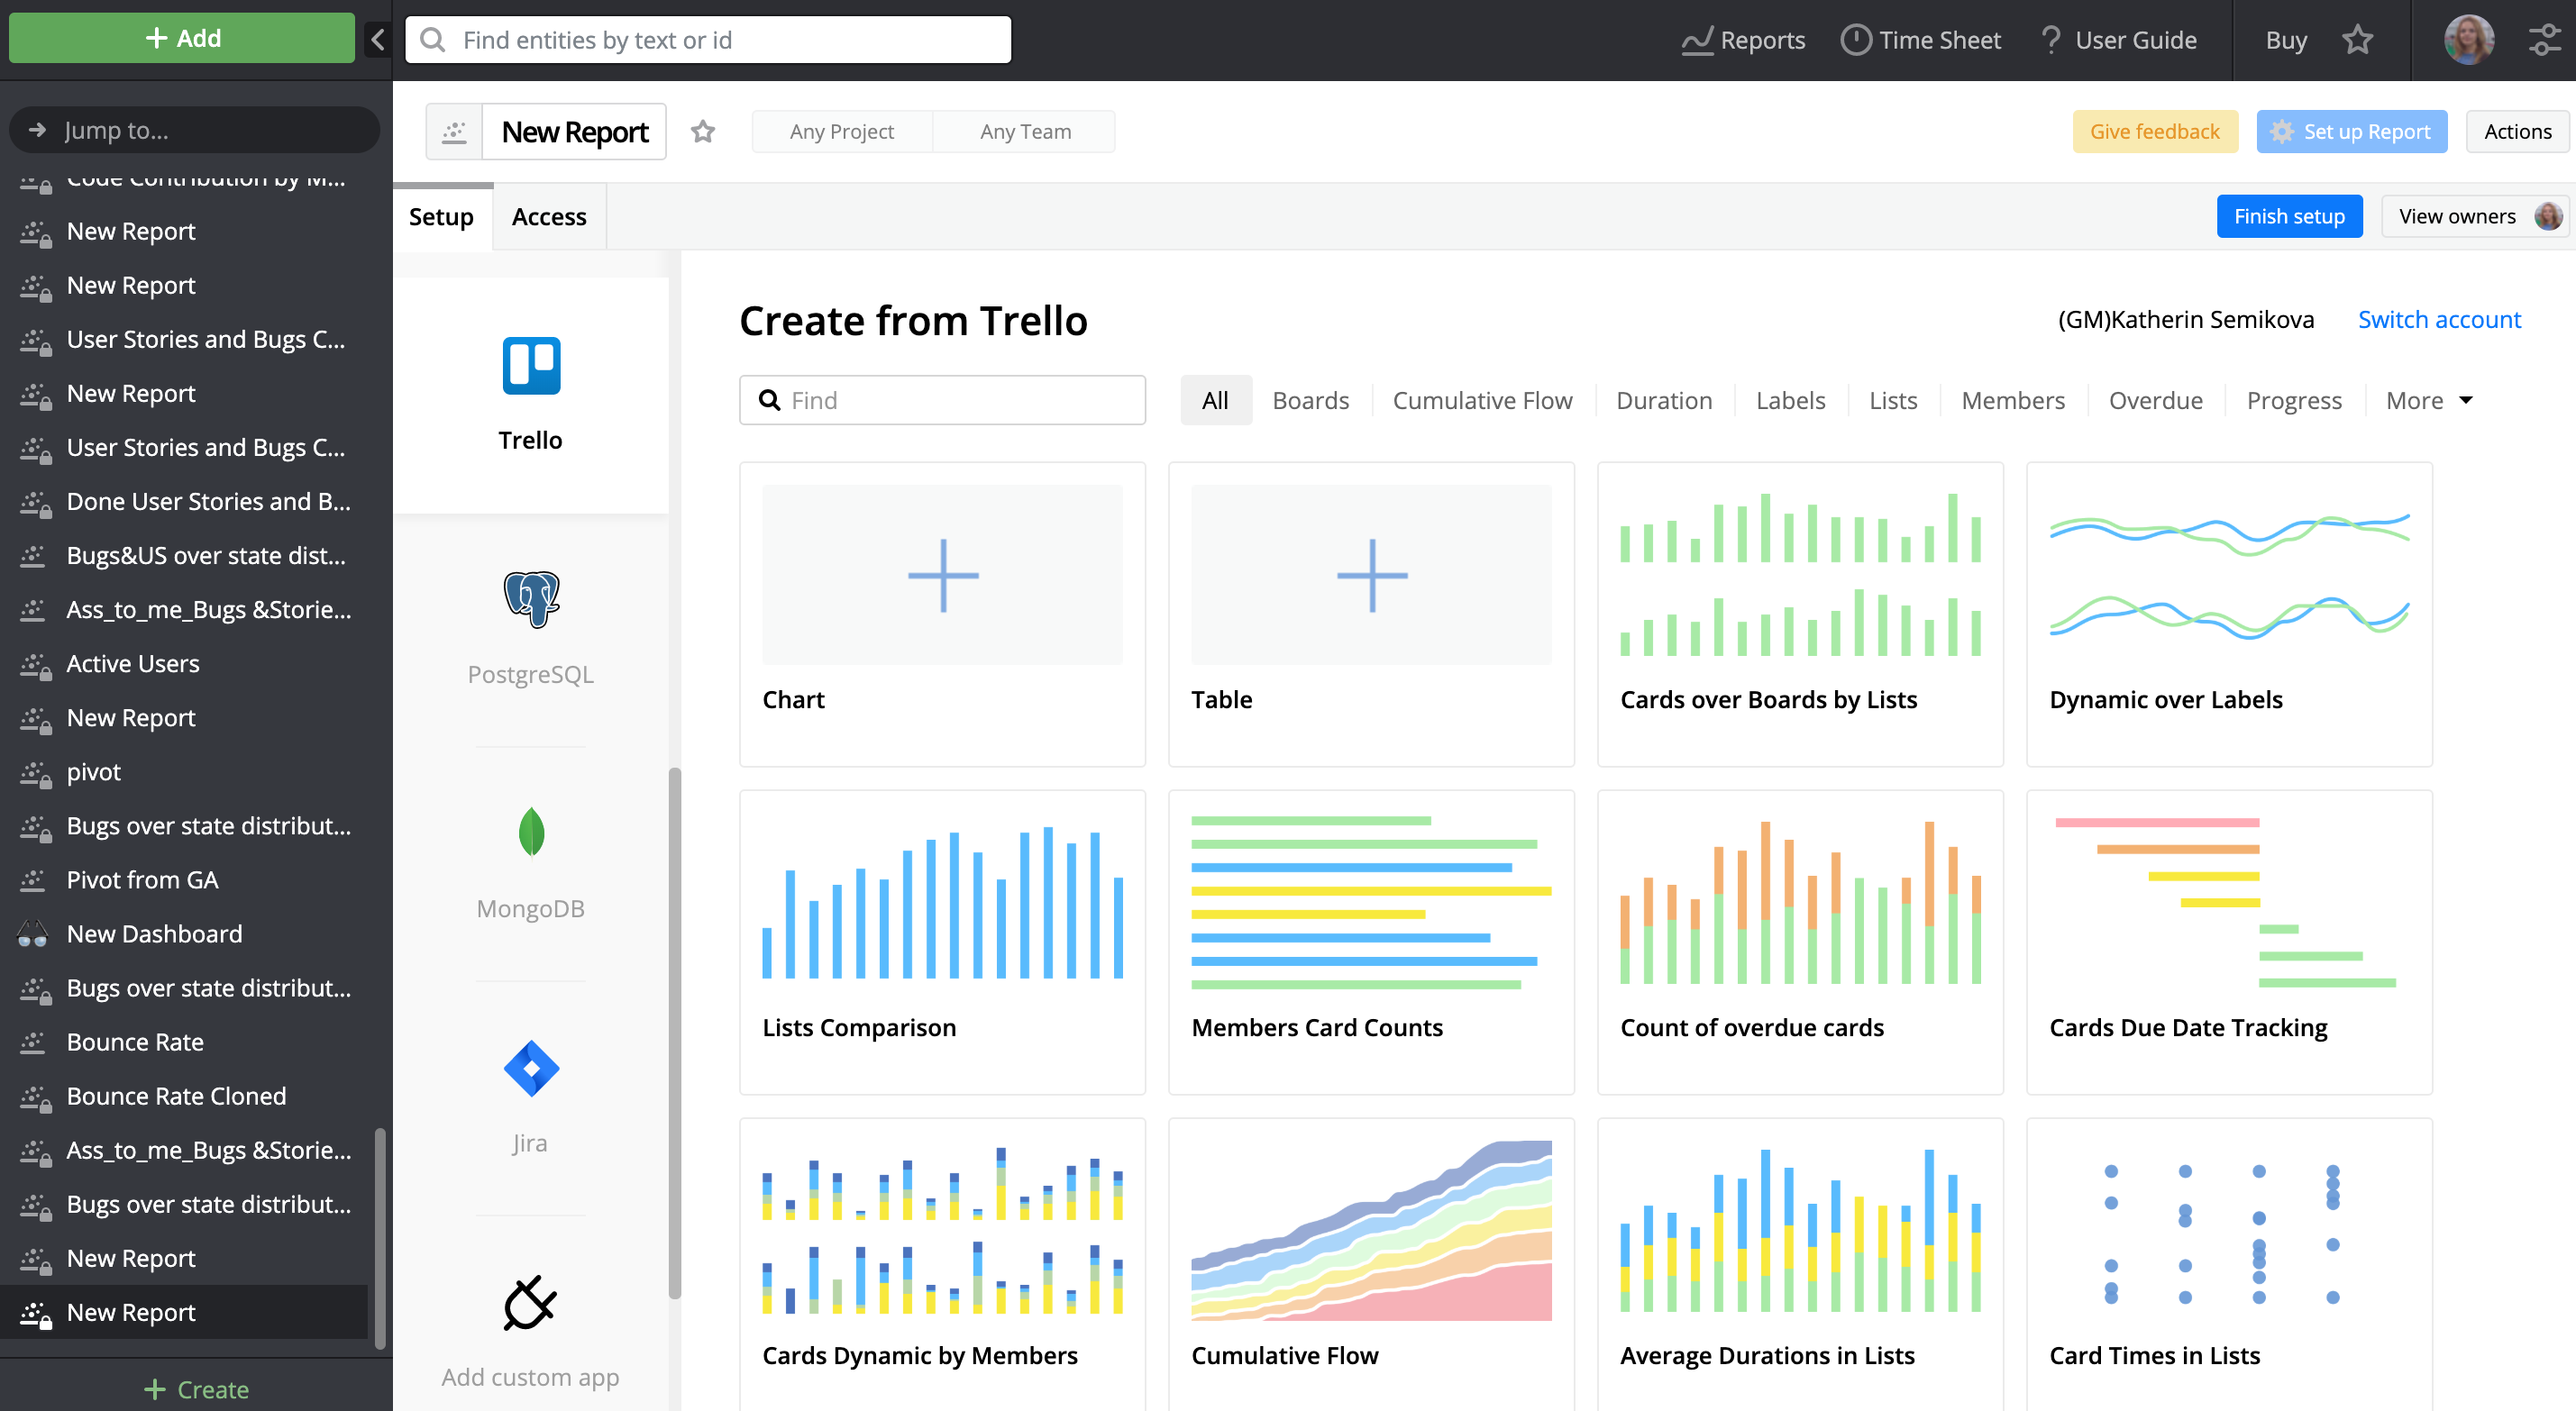
Visual reports: Trello app
In this release, we have added the ability to visualize data from Trello. To start using Trello as a source you just need to connect your Trello account and then you will be able to create reports with data from Trello boards inside Targetprocess.
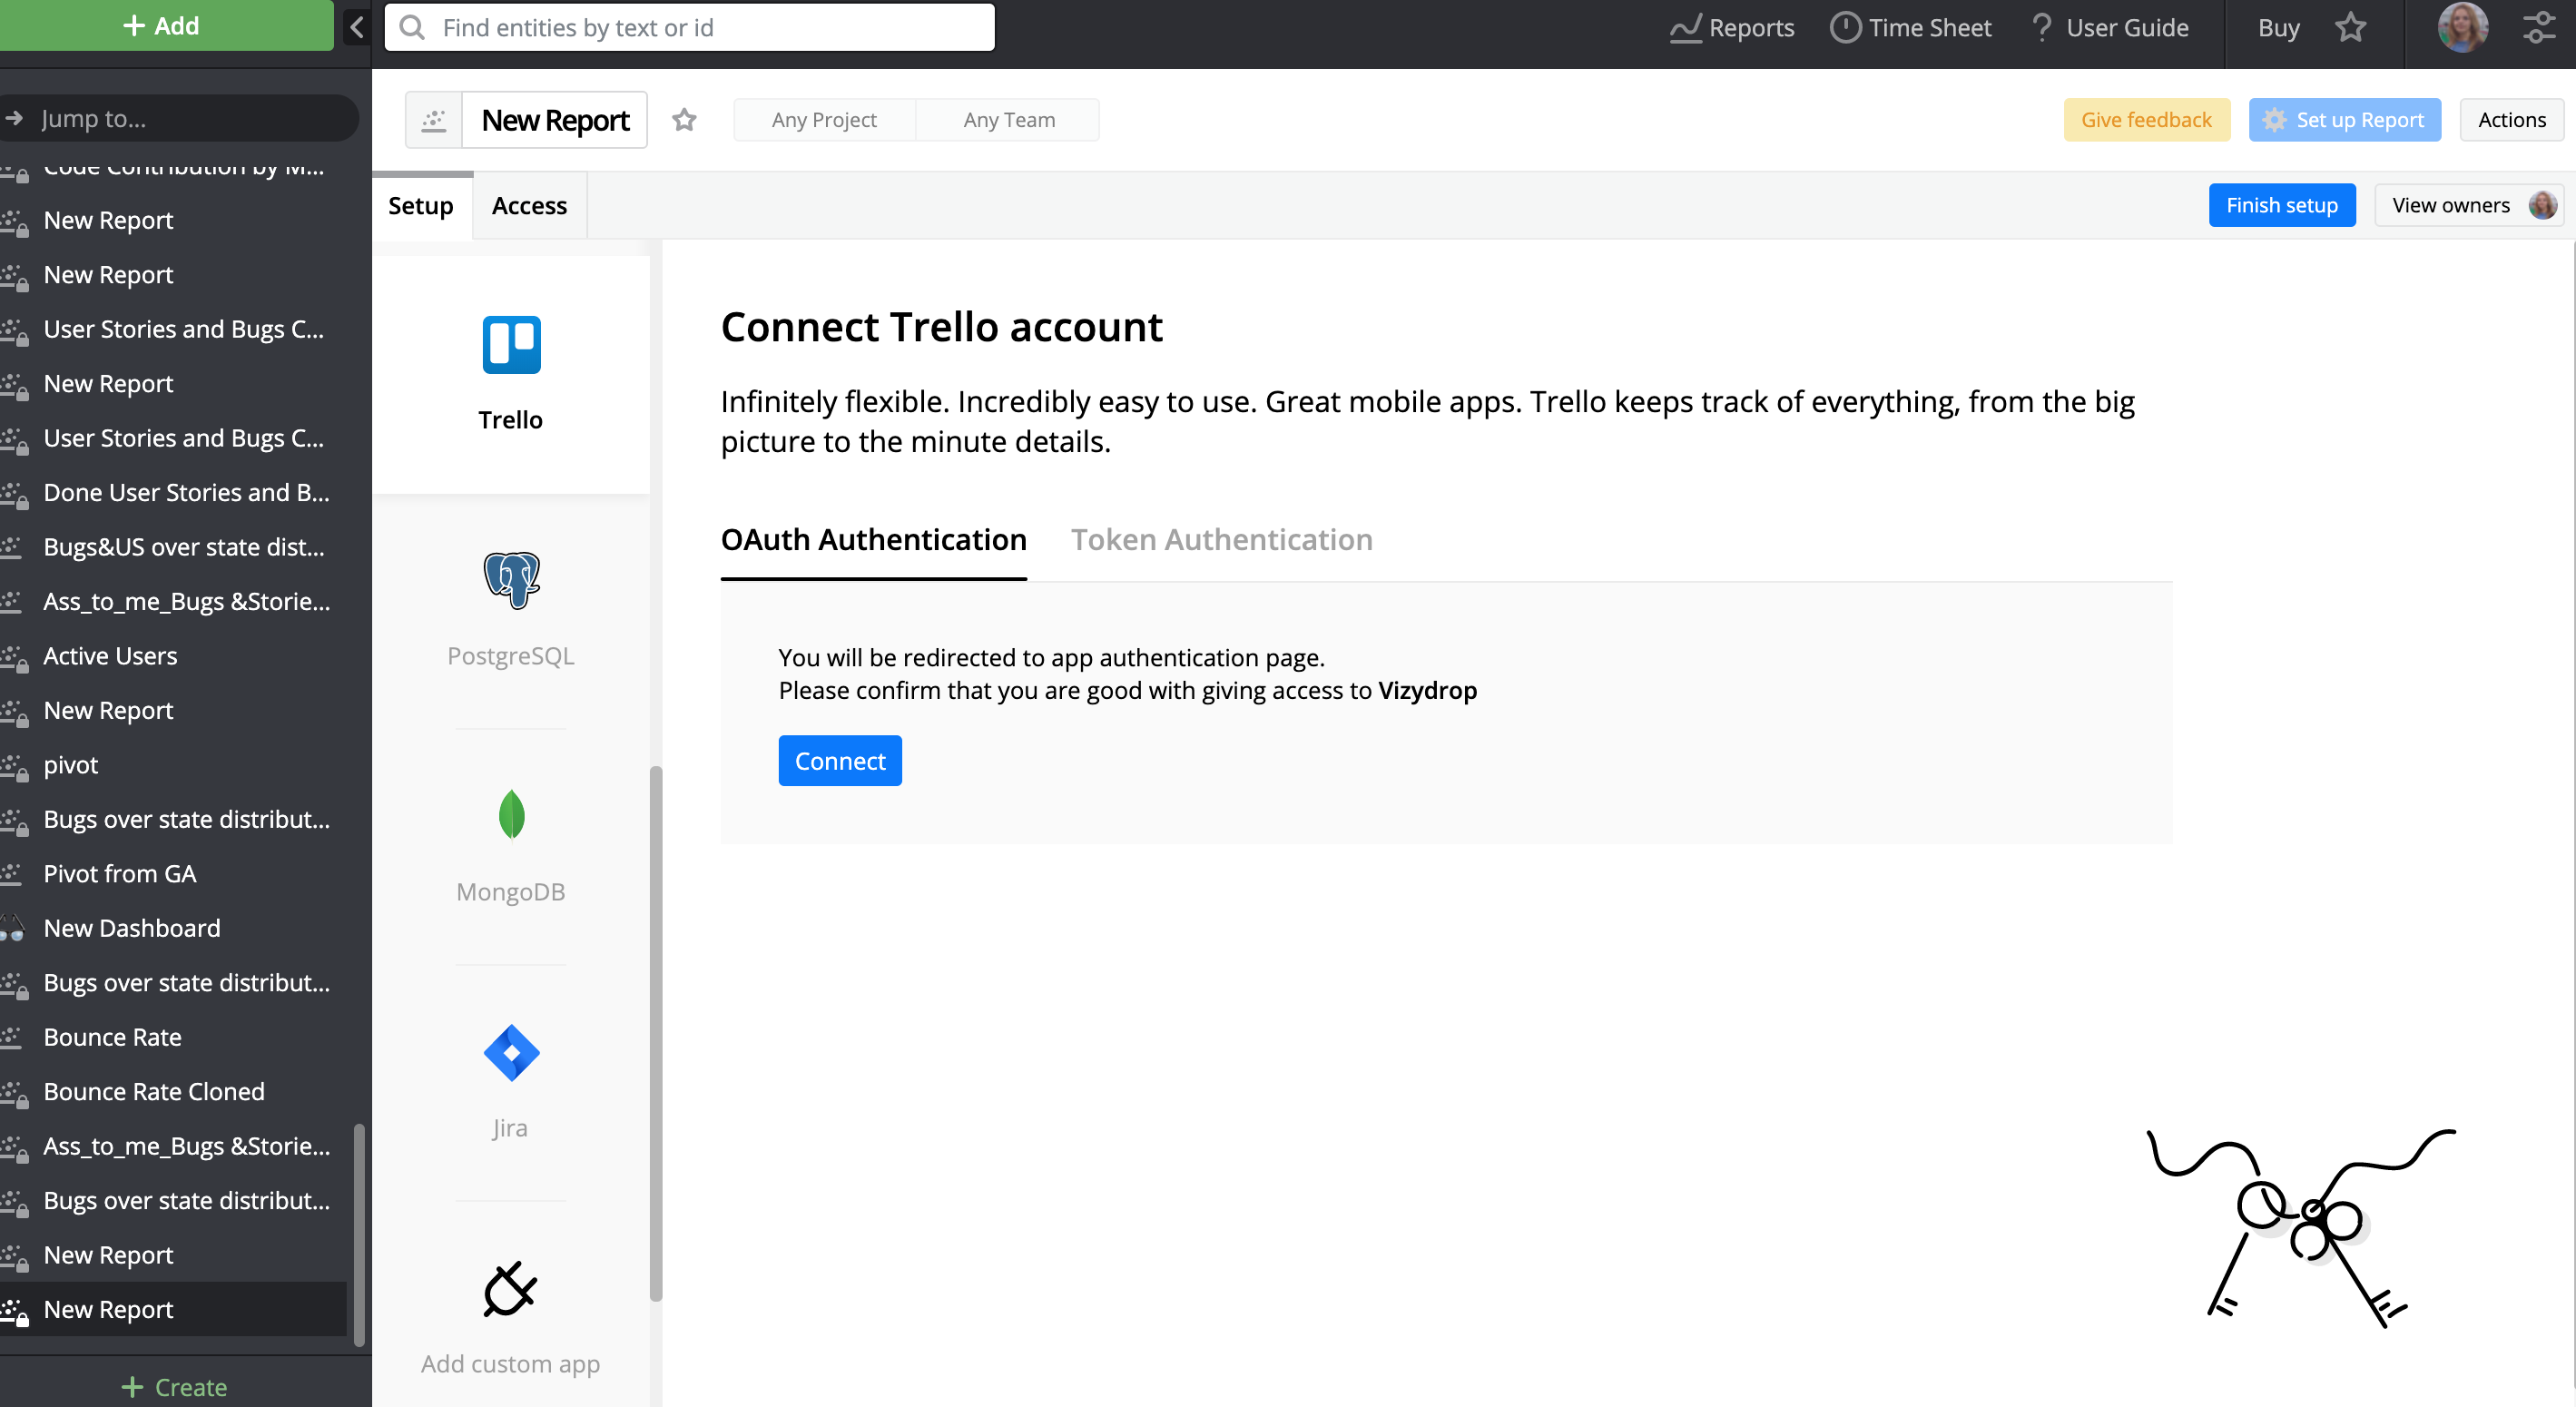
We have added several templates for the Trello app, so you can select one of these or create the report from scratch.
Visual reports: Groups for Visual Tables
We are happy to announce we have added the ability to combine rows in a table by your desired criteria. You are now able to apply up to three groups to any visual table. To learn more information please follow this link.
Visual reports: Ability to pin columns in Visual Tables
There's more good news about Visual Tables. We have added the ability to pin columns in a table, which allows you to make the most important columns permanently visible.
Visual reports: New functions in calculations
There are also some new functions available in calculations: CEIL and ADD_DATE.
CEIL(numerical expression) can be applied to numbers only. The function returns an integer value that is rounded up to the next largest whole number or integer.
Example: CEIL(3.05) -----> 4
ADD_DATE(date, integer) function adds a time/date interval to a date and then returns the date.
Possible options are: ADD_MINUTE, ADD_HOUR, ADD_DAY, ADD_WEEK, ADD_MONTH, ADD_YEAR.
Example: ADD_DAY(DATE('1-Mar-2020'),1), -----> 2-Mar-2020
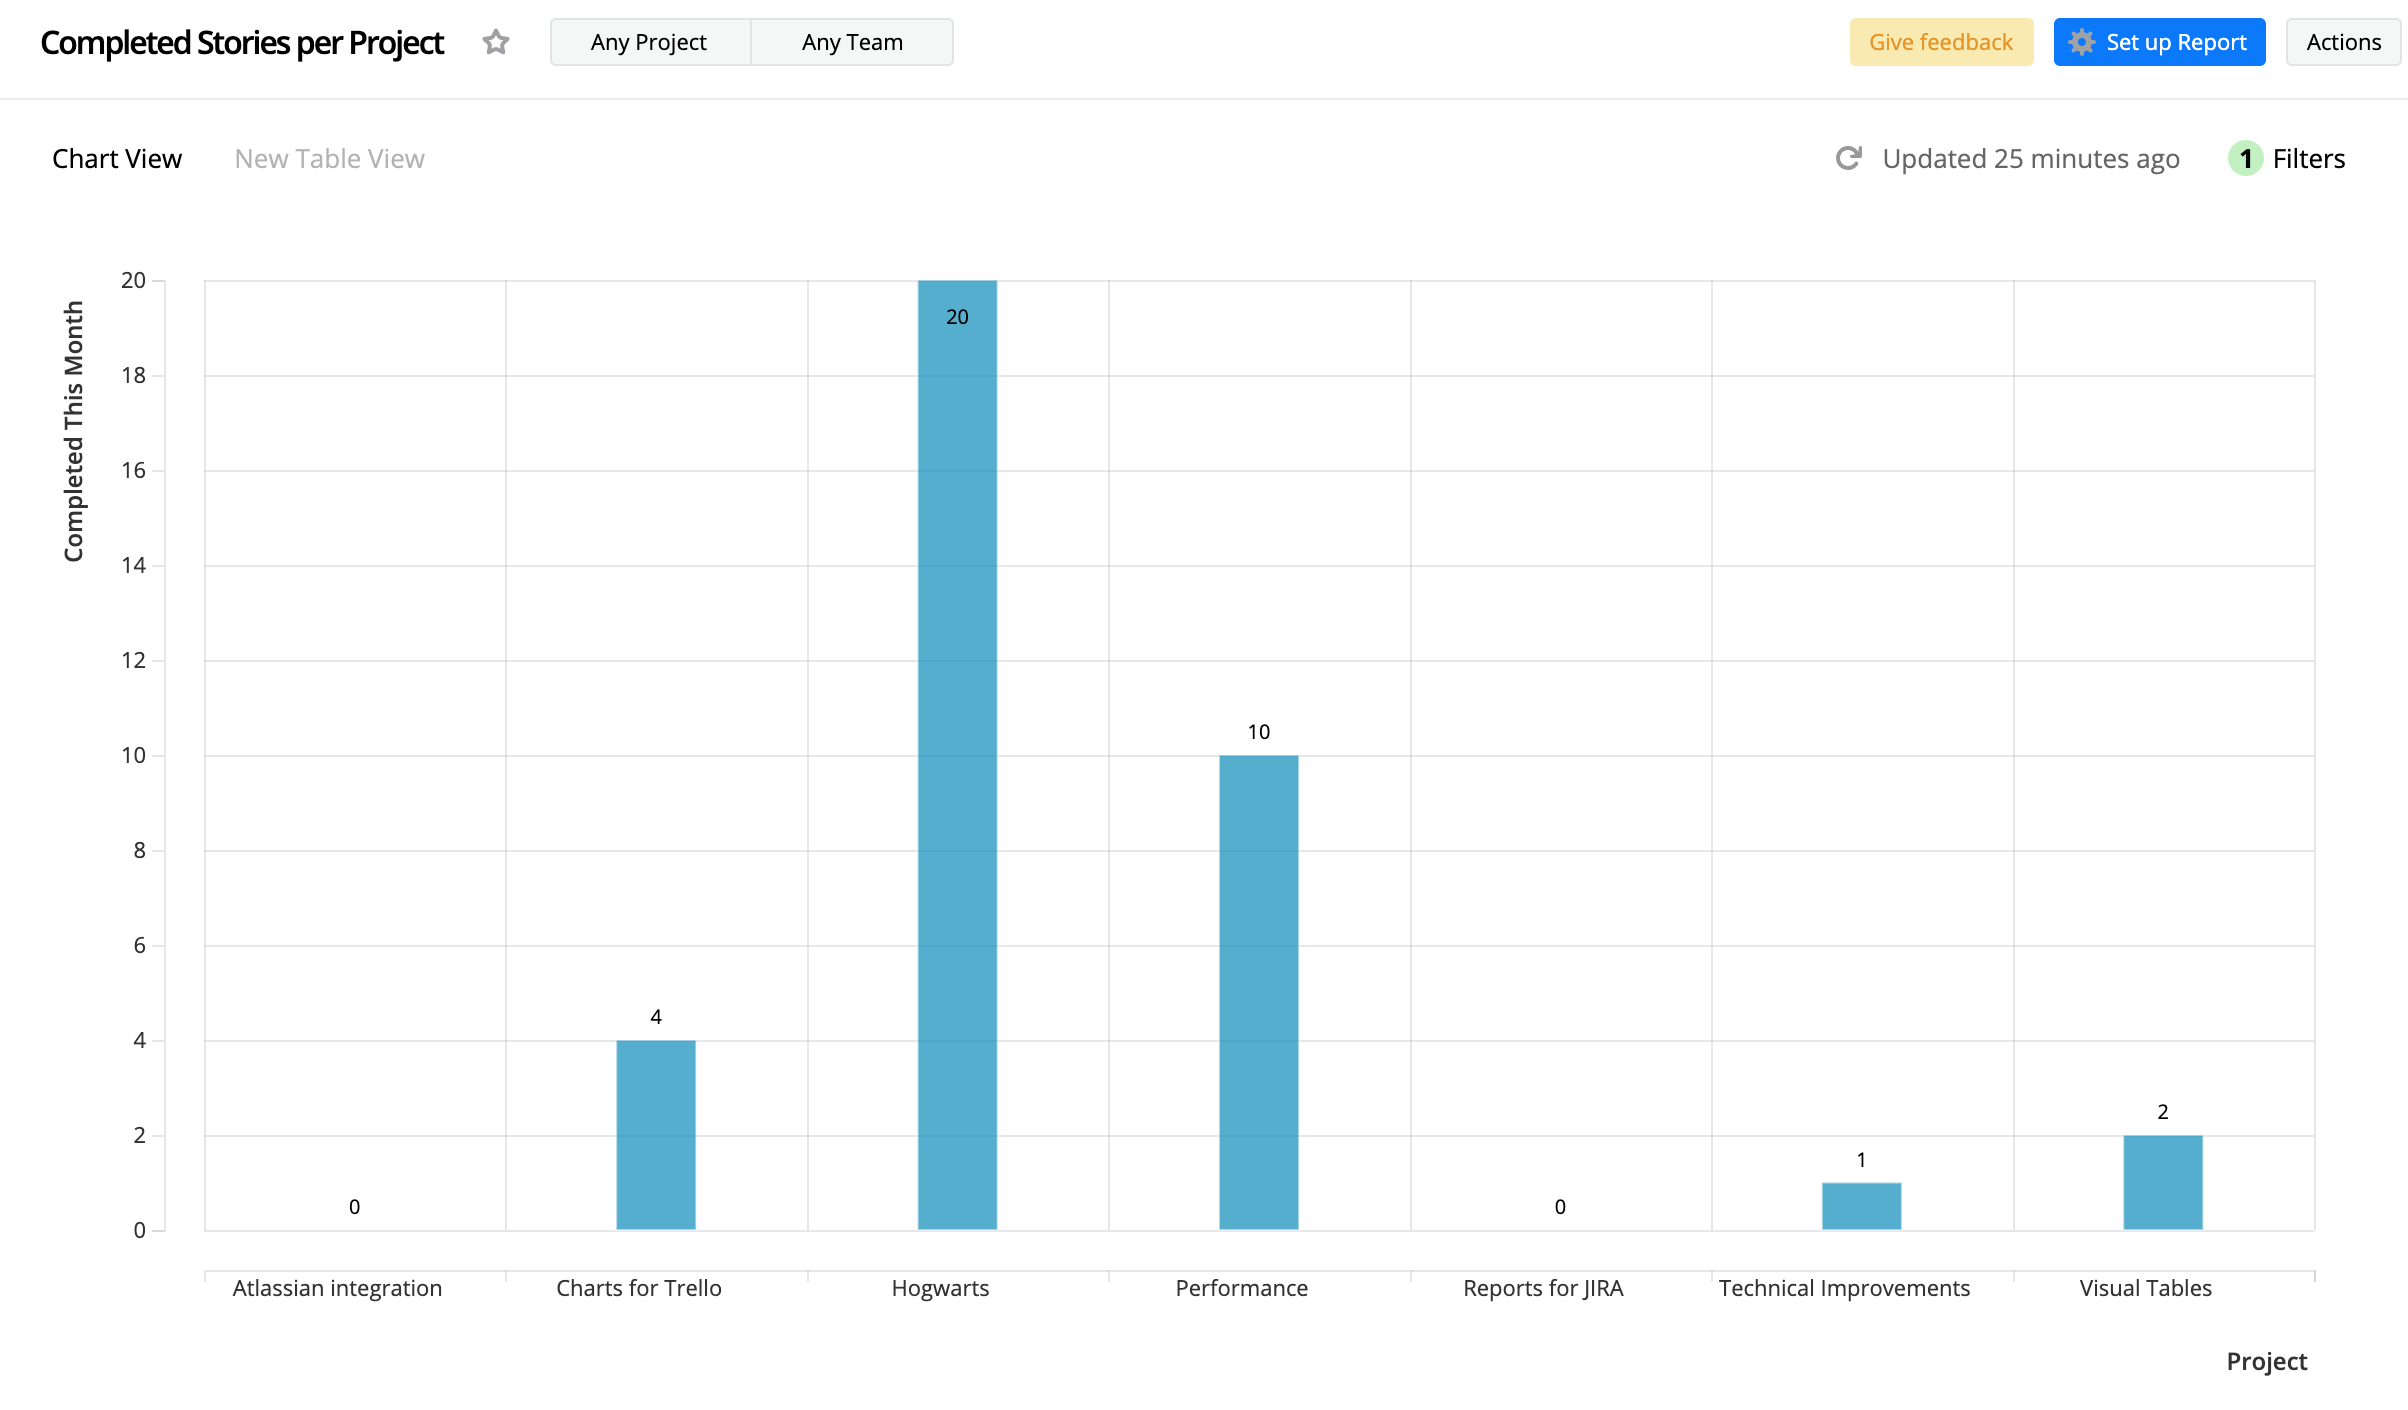
For example, you have a report that shows how many user stories per project were completed this month and you want to compare them with the same values for the previous month.
Below is the initial chart.
Y axis: [Completed This Month] COUNTIF([ID], MONTH([End Date])==MONTH(NOW()))
X axis: [Project]
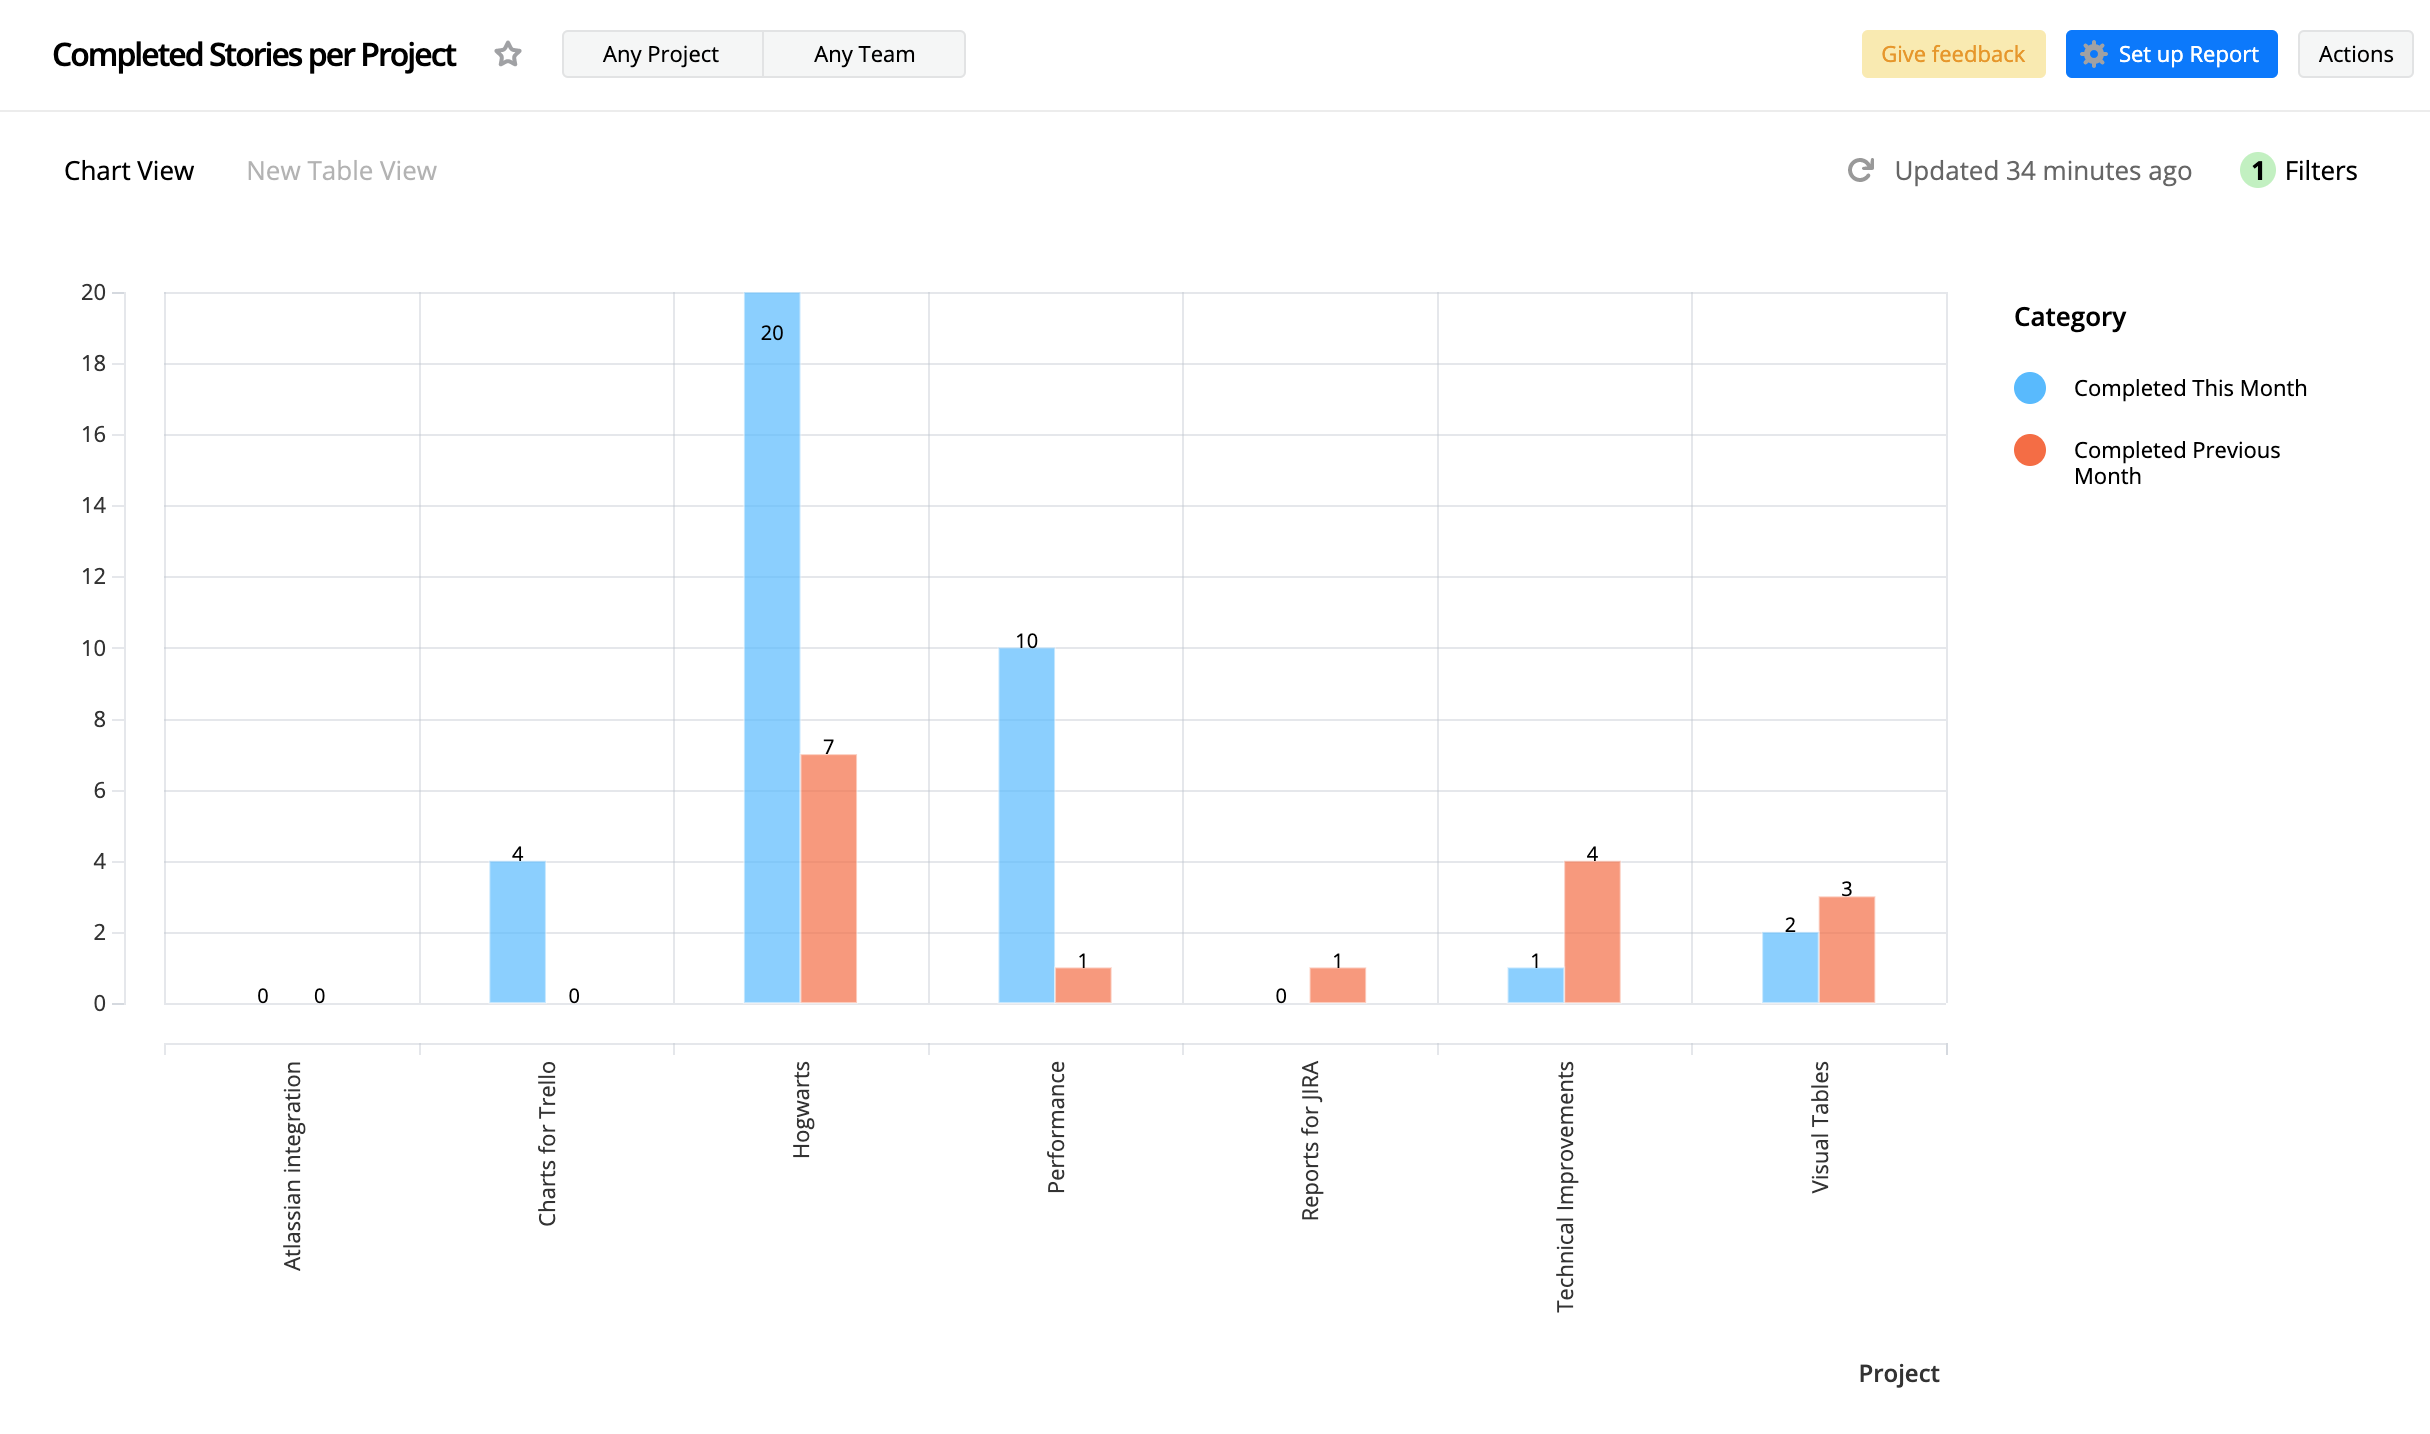
To visualize the same value but for the previous month, the following calculation should be used:
[Completed Previous Month]
COUNTIF([Id],MONTH([End Date]) == ADD_MONTH(MONTH(NOW()),-1))
Visual reports: Color legend for charts on dashboards
We have added a color legend for charts on dashboards, so now exploring data becomes even easier.

Visual reports: Ability to disable filters
We've recently added the ability to disable filters. This means you don't need to delete a filter if you want to explore data, you can just disable the filter and enable it again whenever you need it.
Minor improvements
- Text editor controls are frozen when the Description field is scrolled down.
- Ability to select Date range lanes for Release/Iteration/Team Iteration entity types has been added to the board.

Fixed bugs
- User login is now defined correctly when you click 'Reply' to someone else's comment
- Items are now displayed correctly after changing priority
- Projects already assigned to Milestone are not shown in Project lookup on the Milestone detailed view
- States from multiple process workflows are displayed in the right order after hiding empty lanes
- Visual Reports: fixed values calculation in pivoted columns
- Visual Reports: fixed Difference calculation in case of binary expressions
- Visual Reports: fixed error if you use aggregated dates in DATEDIFF calculation
- Visual Reports: fixed error if you use aggregated dates with group by calculation
- Visual Reports: fixed error on applying greatest/lowest filter to field used in RUNNING/DIFF
- Visual Reports: fixed error on opening source data if type of array text field was changed to Date
- Visual Reports: fixed sorting for intervals
- Visual Reports: fixed error if you add a Running calculation on the chart with Timeline
Add comment