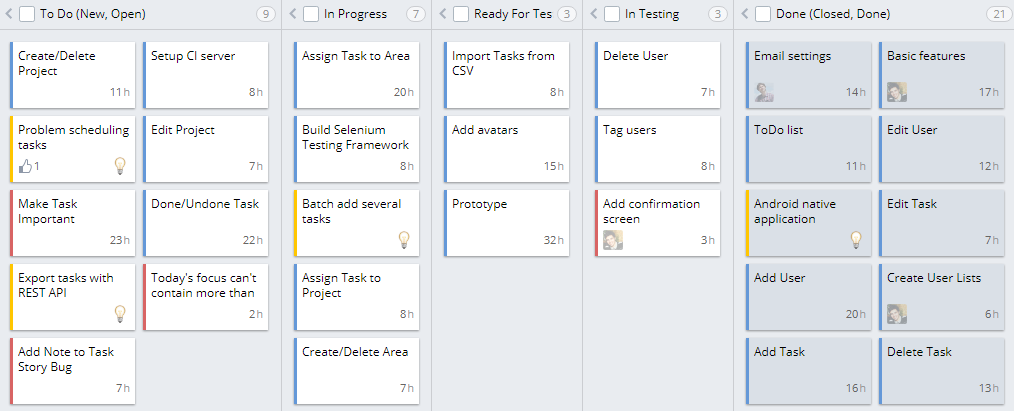
Cards on views for different types of entities in Targetprocess have colored strips on their left side. For instance, User Stories have a light blue strip, Bugs have a red one, and Requests are indicated with yellow. However, sometimes the indication can be quite subtle. This article describes how to configure alternative ways to distinguish cards by entity type: color highlighting and distribution by lanes.
It may happen that on the same board a small team handles User Stories, Bugs, and Requests together. All the team's work is shown in one place. But it's easy for new Requests to get lost in the Ideas or Backlog state amongst all the other entities. The solution below helps to solve this problem.
Visual Encoding per Entity Type
It is possible to add colored highlights to cards with Visual Encoding rules. Here is how the board looks like with some example rules applied:
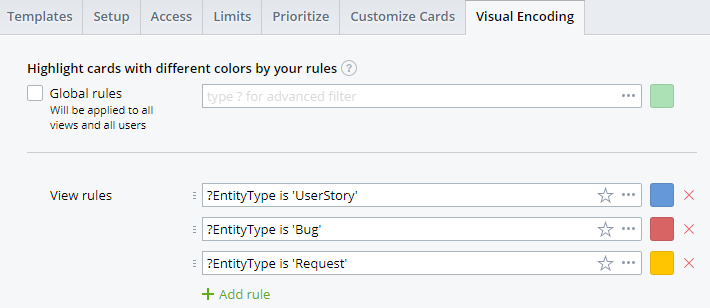
And here is how the view settings are configured. Open Actions > Set up view menu item > Visual Encoding tab to access the settings. Use the following rules:
?EntityType is 'UserStory'
?EntityType is 'Bug'
?EntityType is 'Request'
Distribution by Lanes per Entity Type
We'll use the capability of Targetprocess to distribute cards on a board based on custom field values. We'll add system (read-only) custom fields of type Drop Down List, and we'll configure the system to populate the fields with custom rules configured in a Metric.
The configuration contains three major steps: add custom fields, set up the metric, then create and customize view.
Add Custom Fields
Add custom fields with the same settings to all types of entities that appear on your common view for all team work: User Stories, Bugs, and Requests.
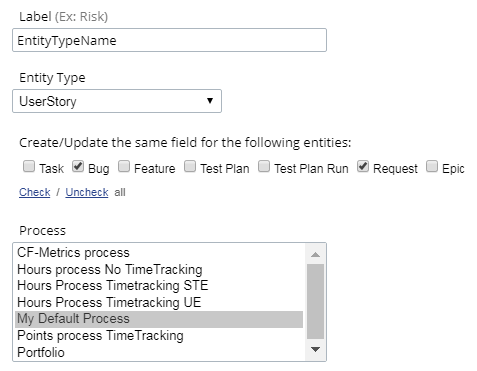
Navigate Settings > Custom Fields menu item. Press Add link. Use the following settings:
- Label: EntityTypeName
- Entity Type: UserStory, Bug, Request
- Process: select process(es) of the project(s) that contain your cards
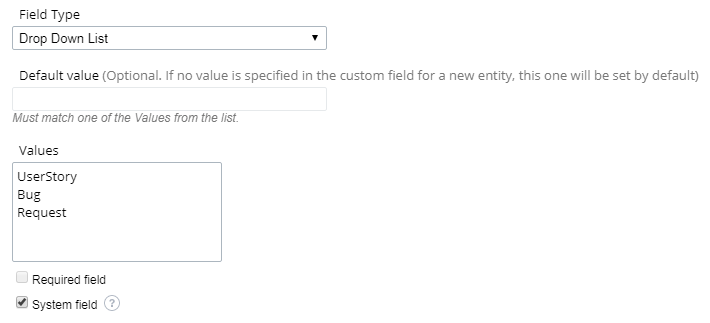
Add a Drop Down List custom field with System attribute and the following list of values:
UserStory
Bug
Request
Save the settings of the field. Done! The three fields are added.
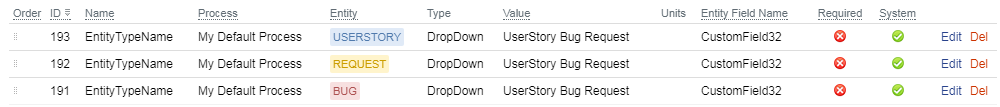
Set up Metric
Add a common Metric with same settings to all types of entities: User Stories, Bugs, Requests.
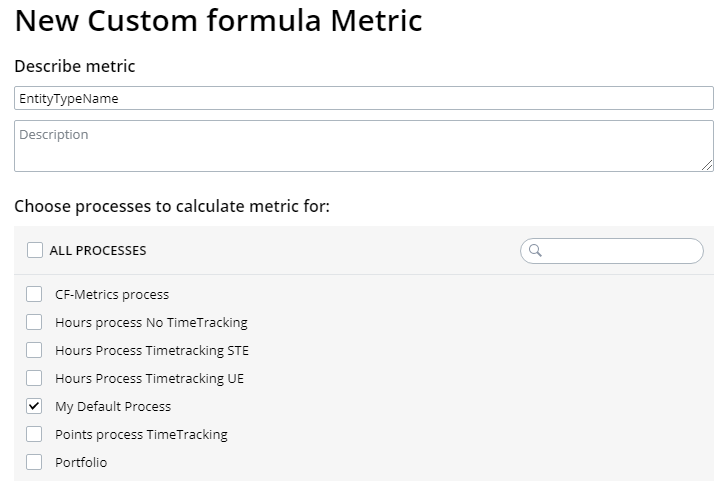
Navigate to Settings > Metrics menu item. Press Add > Custom formula buttons. Use the following settings:
- Describe metric: EntityTypeName
- Choose processes: select process(es) of the project(s) that contain your entities, the same you used for the custom fields
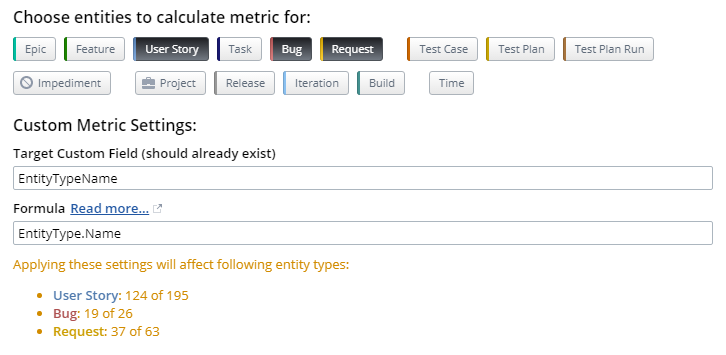
- Choose entities: User Story, Bug, Request
- Target Custom Field: EntityTypeName
- Formula:
EntityType.Name
Press Add metric button to save its settings. Wait until the recalculation is 100% completed:
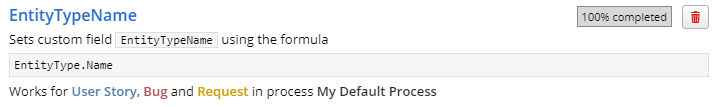
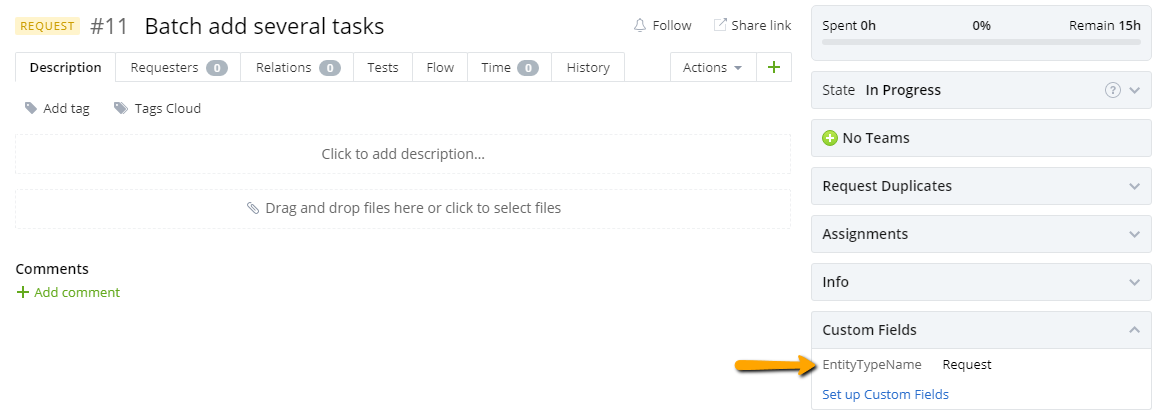
Done! Close the settings. Now, if you open a detailed view for any User Story, Bug, or Request in your Project, in the Custom Fields area you will see the calculated name of entity type now appears:
Create and Customize View
In the settings of your Team Work view, configure the distribution of cards by lanes per calculated entity type.
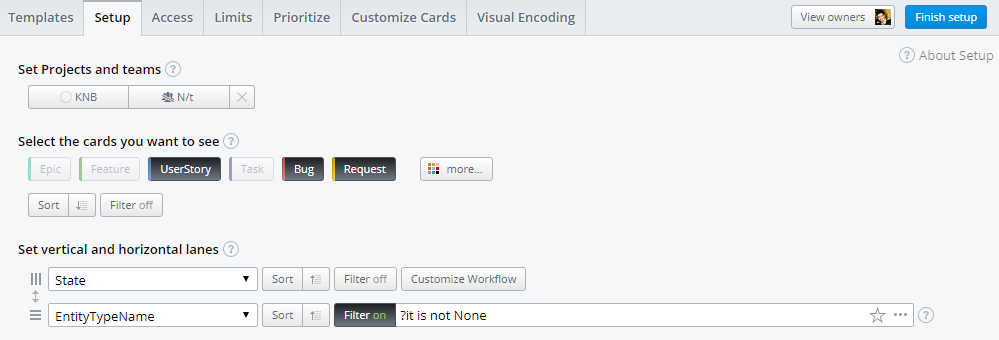
Open Actions > Set up view menu item > Setup tab to access the settings. Use the configuration shown below:
- Select the cards: User Story, Bug, Request
- Vertical lanes (columns): State
- Horizontal lanes (rows): Custom Fields > EntityTypeName
And apply the filter to rows in order to hide No Value lane:
?it is not None
Press Finish setup button. We are done, finally!
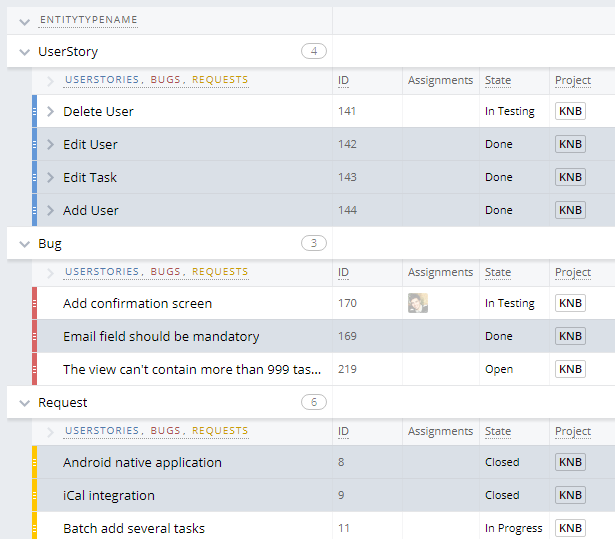
Here is how the board view looks with the new distribution:
Distribution in List Views
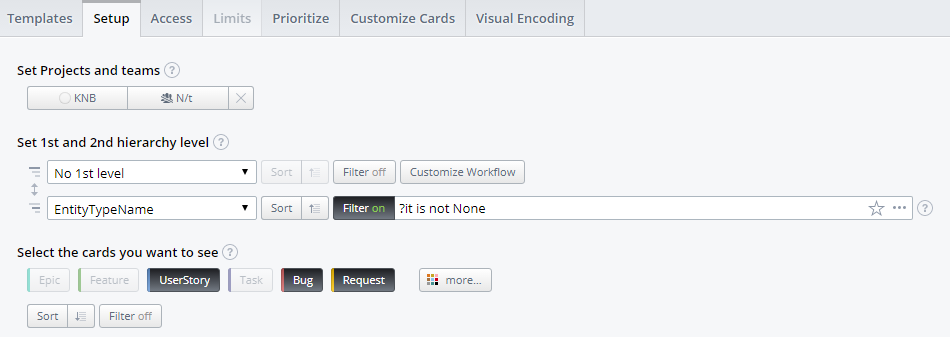
The same settings are compatible with list views as well:
Here are the settings of the view shown above:
Still have a question?
We're here to help! Just contact our friendly support team
Find out more about our APIs, Plugins, Mashups and custom extensions. Join our community of passionate users and even discuss directly with our developers.