This report is one of personal velocity reports.
As Custom graphical report, this report is obsolete. It is still supported for On-Premise accounts only. Use Visual reports instead.
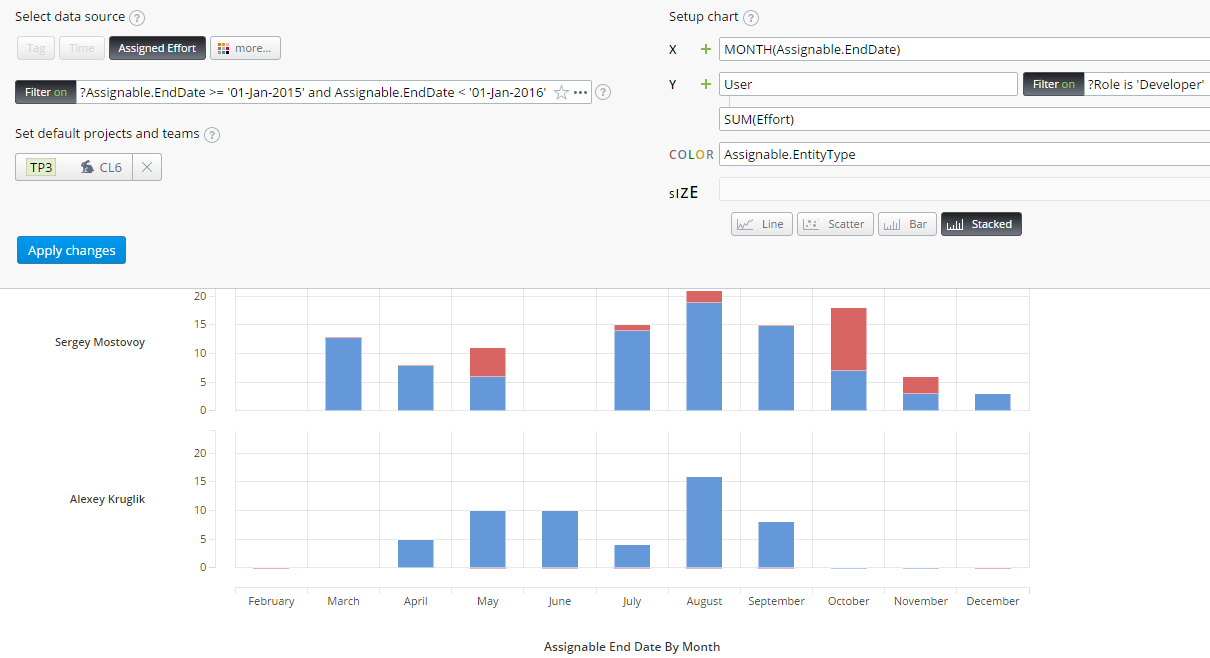
Monthly Completed Effort Per Developer
Data Source Filter
The current filter shows entities completed during a fixed time period in the past:
?Assignable.EndDate >= '01-Jan-2015' and Assignable.EndDate < '01-Jan-2016'
Alternatively you can show entities completed during the last several days:
?Assignable.EndDate >= today-30(days)
However, it is not possible to filter by 'last month' or 'this year'.
X-axis
This report is grouped by the month when the corresponding work item was closed:
MONTH(Assignable.EndDate)
It's important to understand that if a developer was working on an item for several months, all the effort for this item would be included in the month when this item was closed.
You can change the grouping to DAY WEEK YEAR :
WEEK(Assignable.EndDate)
Y-axis
Users are filtered by their default role:
?Role is 'Developer'
You can replace this filter with any other filter for Users, for example to display only members of a particular team:
?TeamMembers.Where(Team.Name is 'Developers')
Another value for Y-axis is Sum of Effort:
SUM(Effort)
If several users are assigned to the same entity under the same Role, the Effort for this Role will be counted for each user. So if two users are assigned to the entity with 5pt of estimated Effort, each of the users will have these 5pt in this chart.
Another useful value to put here would be average Effort:
AVG(Effort)
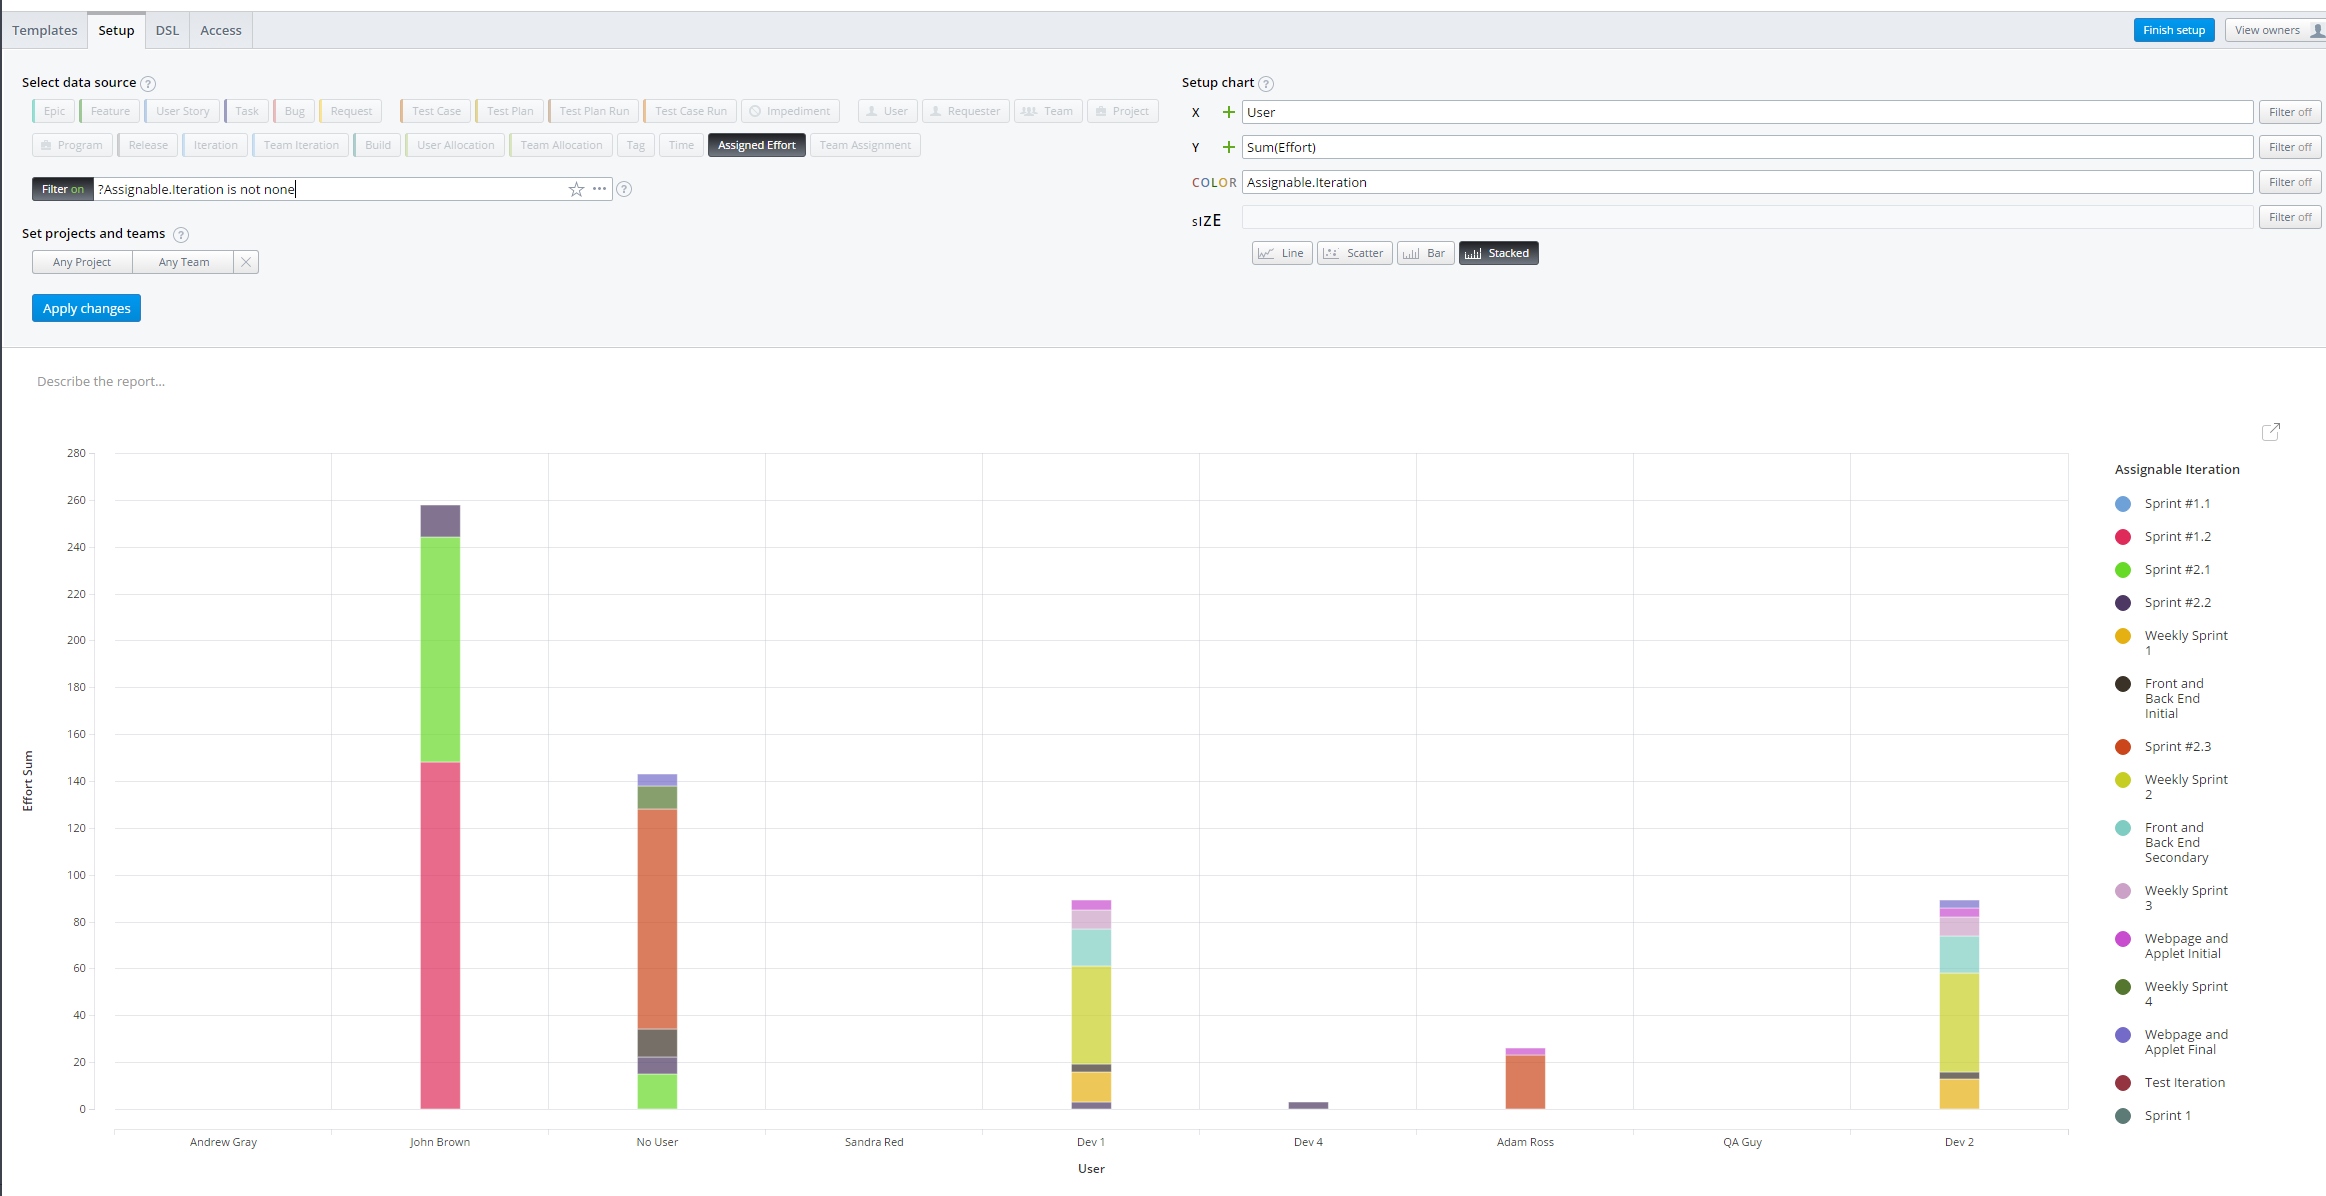
Effort completed per user by Iterations
It is also possible to summarize effort per iteration and not per month:
Still have a question?
We're here to help! Just contact our friendly support team
Find out more about our APIs, Plugins, Mashups and custom extensions. Join our community of passionate users and even discuss directly with our developers.