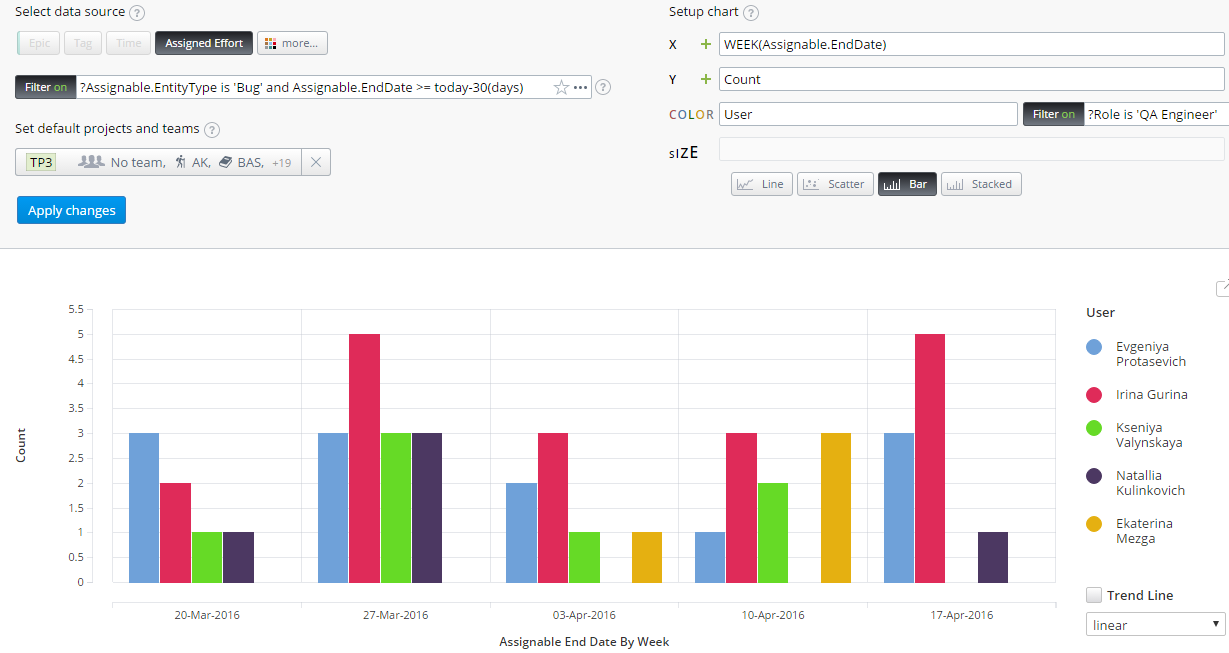
This report shows amount of bugs closed weekly by each QA Engineer. This report is one of personal velocity reports.
As Custom graphical report, this report is obsolete. It is still supported for On-Premise accounts only. Use Visual reports instead.
Data Source Filter
The current filter shows Bugs completed during the last 30 days:
?Assignable.EntityType is 'Bug' and Assignable.EndDate >= today-30(days)
Alternatively you can show Bugs completed during a fixed time period in the past:
?Assignable.EntityType is 'Bug' and Assignable.EndDate >= '01-Jan-2015' and Assignable.EndDate < '01-Jan-2016'
Or you can show other entities, like User Stories, instead of Bugs:
?Assignable.EntityType is 'User Story' and Assignable.EndDate >= today-30(days)
However, it's not possible to filter by 'last month' or 'this year'.
X-axis
This report is grouped by the week when corresponding Bug was closed:
WEEK(Assignable.EndDate)
It's important to understand that if a QA Engineer was working on a bug for several weeks, this Bug would be only counted for the week when it was closed.
You can change the grouping to DAY MONTH YEAR :
MONTH(Assignable.EndDate)
Color
User has a filter by their default role:
?Role is 'QA Engineer'
You can replace this with any other filter for Users, for example to display only members of a particular team:
?TeamMembers.Where(Team.Name is 'Developers')
Still have a question?
We're here to help! Just contact our friendly support team
Find out more about our APIs, Plugins, Mashups and custom extensions. Join our community of passionate users and even discuss directly with our developers.