This report compates estimated effort and time spent by each Developer. This report is one of personal velocity reports.
As Custom graphical report, this report is obsolete. It is still supported for On-Premise accounts only. Use Visual reports instead.
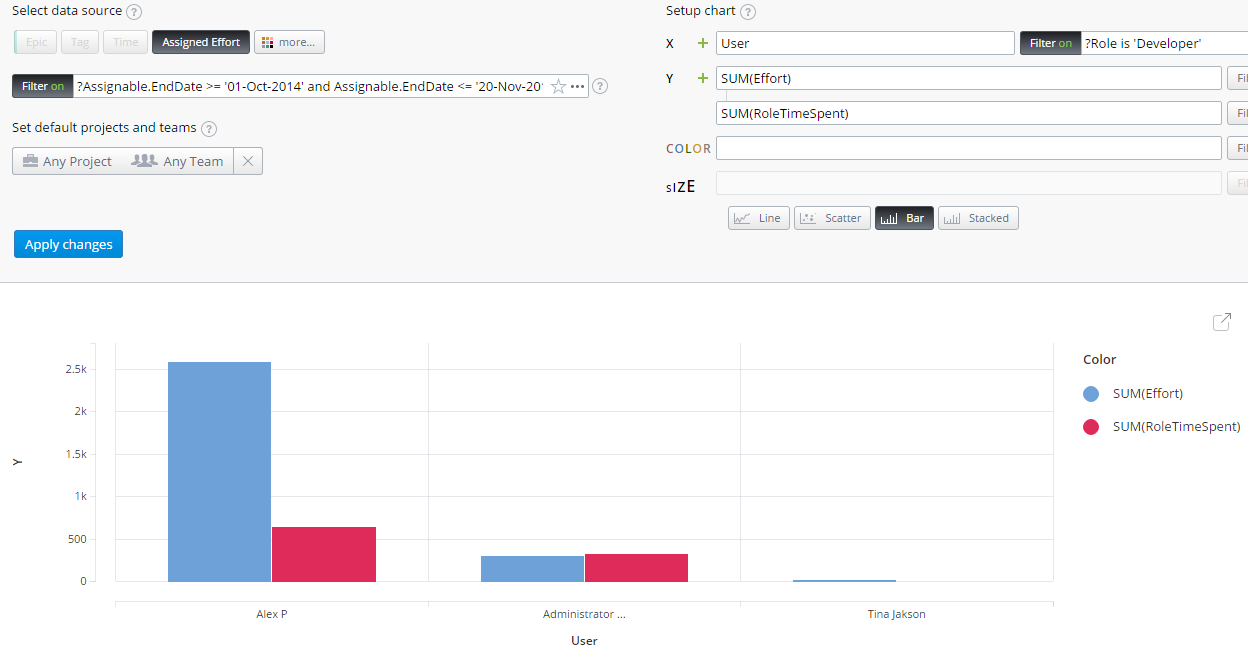
Time Spent vs Estimated Effort Per Developer
Comparing Effort and TimeSpent makes more sense when we are estimating in hours and not in story points.
Data Source Filter
The current filter shows entities completed during a fixed time period in the past:
?Assignable.EndDate >= '01-Oct-2014' and Assignable.EndDate <= '20-Nov-2014'
Alternatively you can show entities completed during the last several days:
?Assignable.EndDate >= today-30(days)
However, it's not possible to filter by 'last month' or 'this year'.
X-axis
Users are filtered by their default role:
?Role is 'Developer'
You can replace this filter with any other filter for Users, for example to display only members of a particular team:
?TeamMembers.Where(Team.Name is 'Developers')
Y-axis
Here you can see a comparison of sums of Effort and of TimeSpent
SUM(Effort)
SUM(RoleTimeSpent)
If several users are assigned to the same entity under the same Role, the Effort for this Role and TimeSpent will be counted for each user. So if two users are assigned to the entity with 10h of estimated Effort and they spent 7h each, both of the users will have these 10h estimated versus 14h spent in this chart.
Still have a question?
We're here to help! Just contact our friendly support team
Find out more about our APIs, Plugins, Mashups and custom extensions. Join our community of passionate users and even discuss directly with our developers.