Available since Targetprocess v.3.10.0
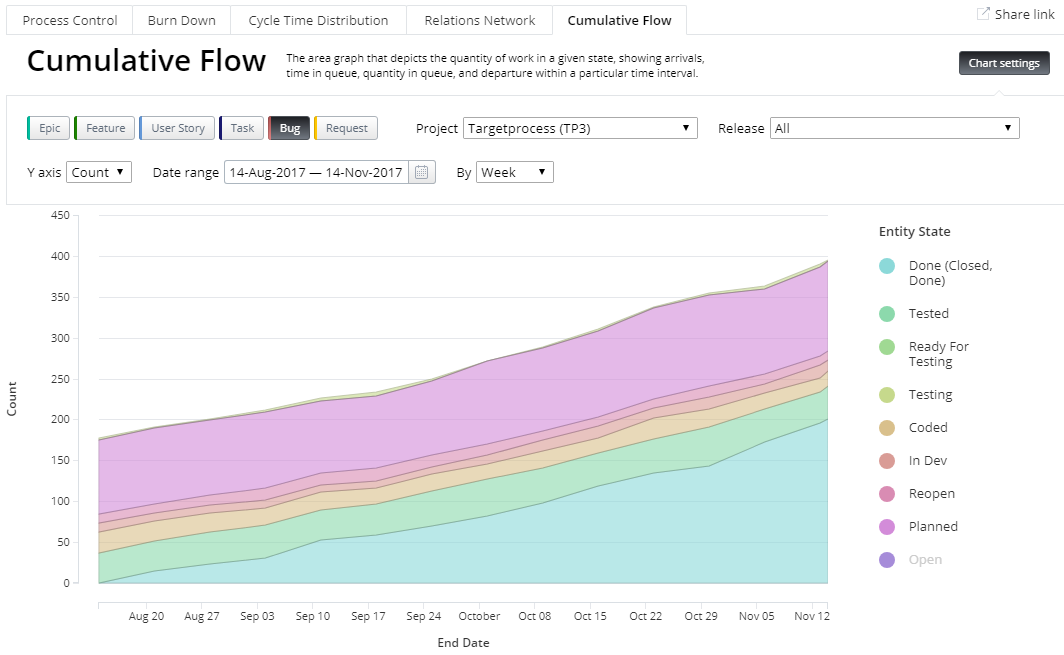
A Cumulative Flow Diagram (CFD) shows how much work is in any given state within a particular interval of time. You can use a CFD to find out how much work is done, ongoing, and in the backlog. It can also help you understand the pace of progress and identify any bottlenecks.
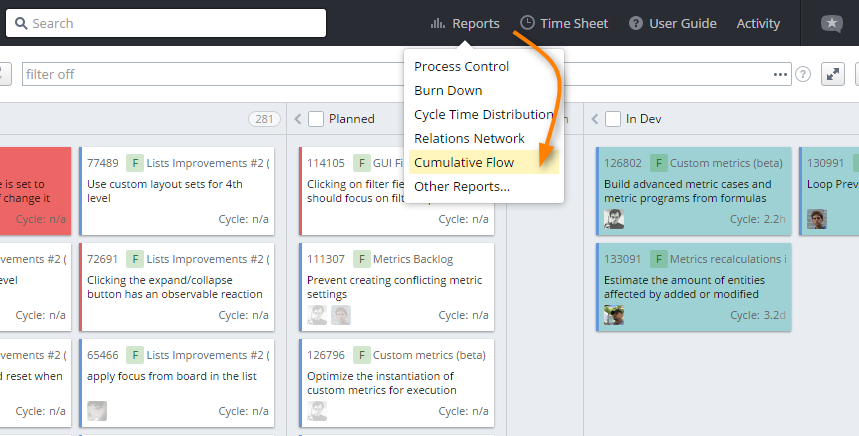
In Targetprocess, can find the CFD in both the Reports section and in dashboard widgets.
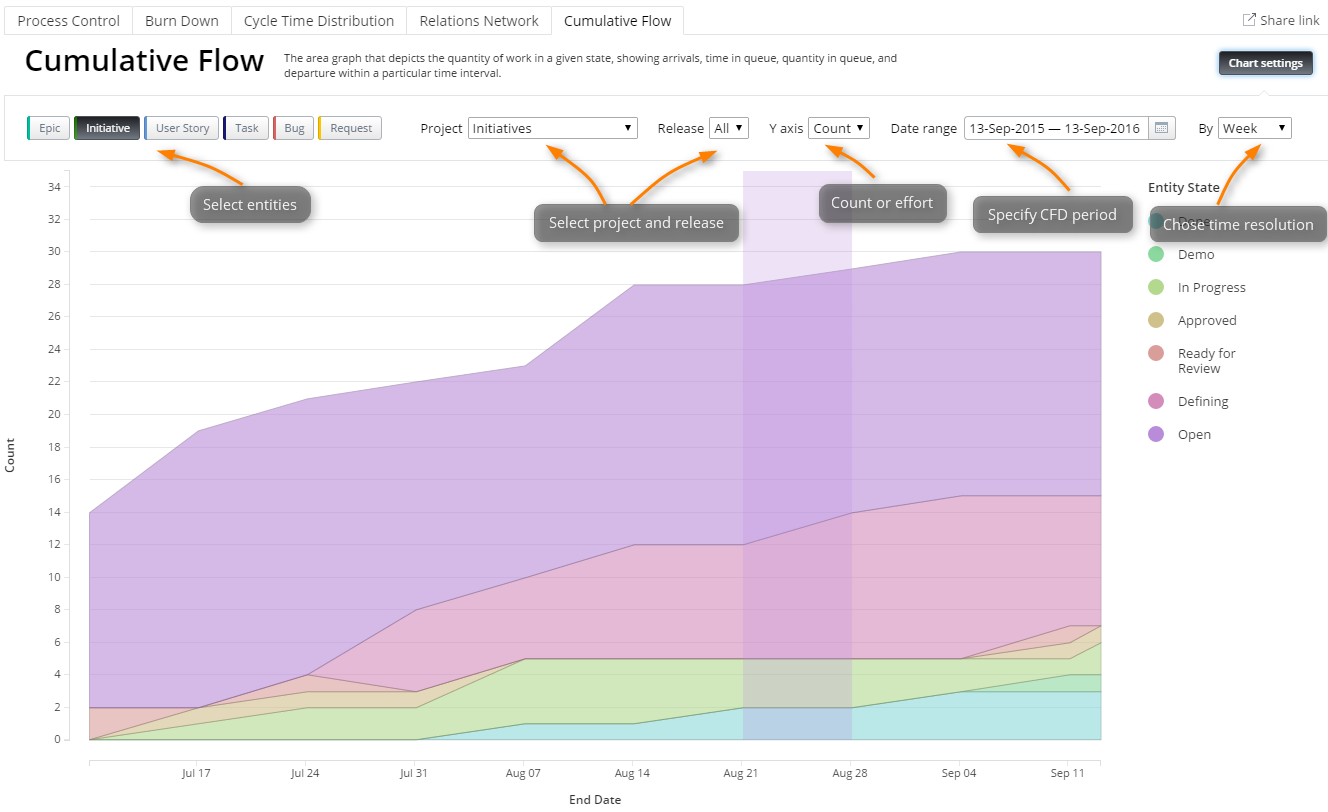
The vertical axis shows how many items are in a specific state. You can toggle the chart to have it display amount of effort per state, rather than number of entities. The horizontal axis shows the timeline. You can make the CFD show data for a whole project or for a particular release by setting a different time resolution (day, week, month, quarter, year).
In the Done state, you can see the total effort and number of entities which were completed during the selected period.
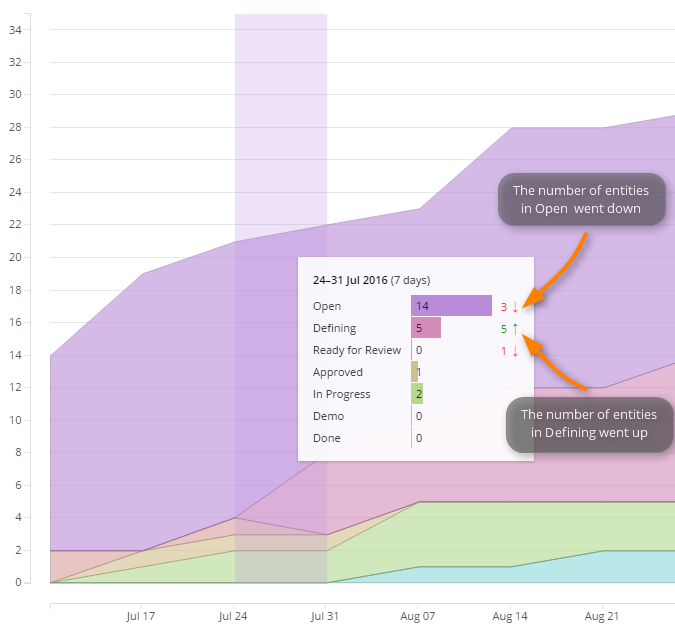
By clicking on any segment of a CFD, you open an interactive tooltip with a detailed overview and exact growth / decline numbers for the selected period.
You can hide states by clicking on them in the legend. This way, you can focus only on the states you want to see.

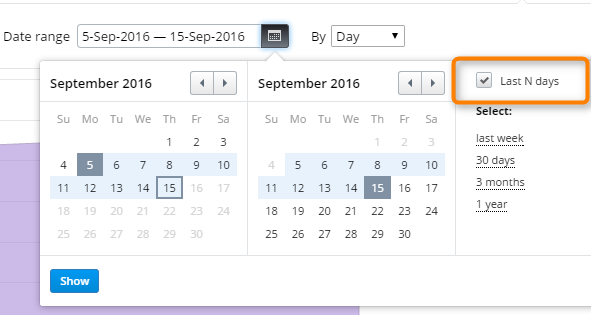
You can set a running date range for your CFD using the 'Last N days' checkbox. Let's say you want to see a chart not for specific dates but for some defined time period (for example, the last 10 days). Just select the last 10 days in the date selector and check 'Last N days'. The date range will be shifted every day automatically, and you will always see the CFD for the last 10 days.
When you build CFD on Dashbord, it is possible to create several charts for different Projects and Releases on the same Dashboard.

Bug Counts By State
Since Targetprocess v3.10.5 some predefined reports based on old charting engine are no longer available. Bug Counts By State report is one of them. It has no replacement so far, though work on the replacement is still in progress. Cumulative Flow diagram for Bugs is the closest replacement for the cancelled report at the moment.
Still have a question?
We're here to help! Just contact our friendly support team
Find out more about our APIs, Plugins, Mashups and custom extensions. Join our community of passionate users and even discuss directly with our developers.