Requires the following solutions to be installed:
- Agile Release Trains (ARTs) (edcffe31-75d3-40b8-9b16-6fbfa380466e)
- A Dependency instead of an Impediment (a7e3a685-8ac0-40d6-a642-3d4206604099)
It can be extended by the following solutions:
- Team and ART PI Objectives (786941ff-055a-4b1e-a9de-6d12fd35ca8d)
- Iteration Goals (84b88da3-9bb0-40ab-ac31-2c0304c55702)
- Acceptance Criteria for Feature (54cd155b-888b-4eb8-abc9-398474f29b23)
- Acceptance Criteria for User Story (a56a7b30-d7d0-4246-ba32-e4010ab53033)
- Feature Definition of Done (DoD) (e117946f-b943-4e33-b615-70be388d0b54)
- User Story Definition of Done (DoD) (a4e9184a-0123-4b39-8cba-695659fbf43d)
- Bug Definition of Done (DoD) (02430c79-7f57-4b3e-9f63-8cfef1992930)
- Retrospectives (ccc47c7d-0107-42cb-8143-493db37c9eb0)
- ROAM Risks (c46ba698-5cee-4a7e-91af-8bbd3f9dc88b)
--------------------------------------------------------------------------------------------------------------------------------------
Solution Overview
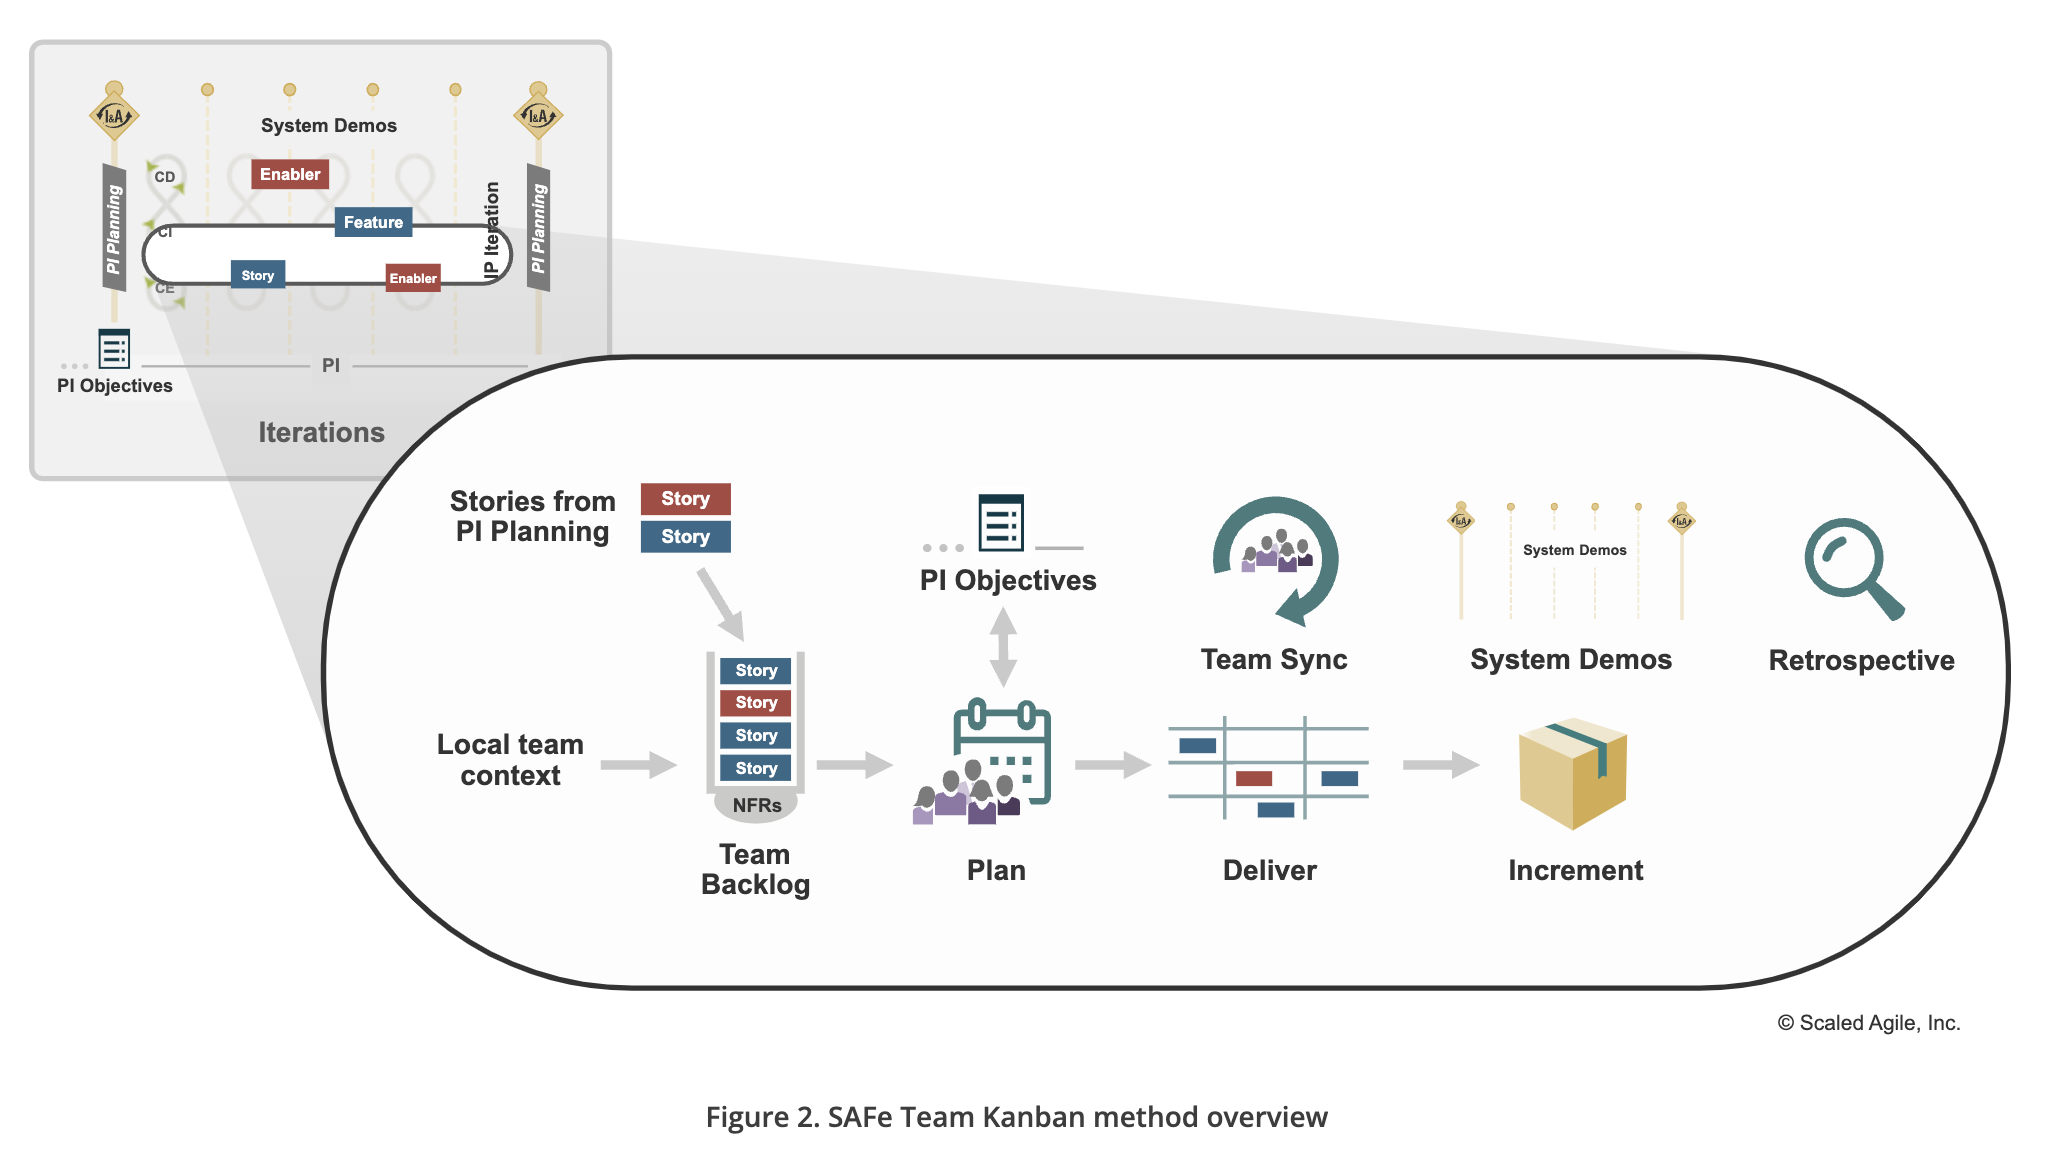
The SAFe Team Kanban Method is an Agile practice that utilizes Kanban principles to help teams visualize and manage their workflow, limit work in progress (WIP), and optimize the delivery of value. It provides a transparent and collaborative approach for teams to continuously improve their processes, enhance productivity, and align with the larger objectives of the Scaled Agile Framework (SAFe).
Solution Flow
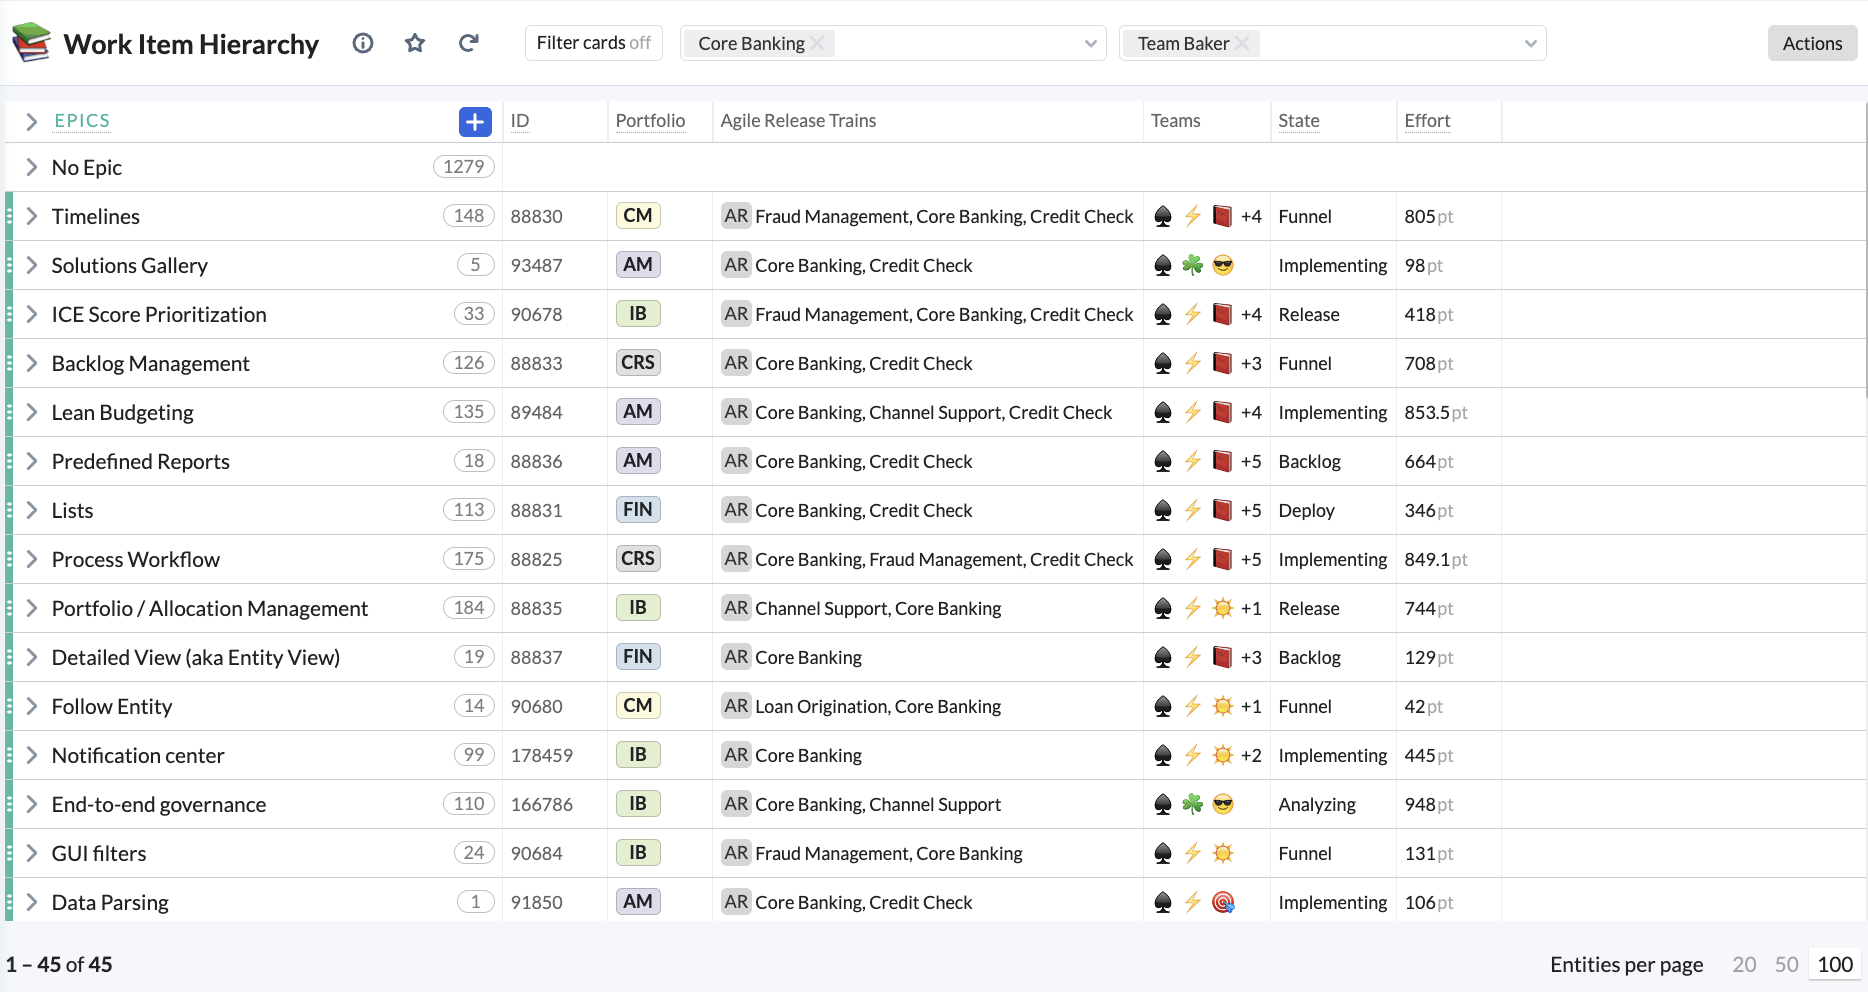
Work Item Hierarchy List
On the first view of the solution, you can find the list of Epics, Features, User Stories, and Bugs, and simply filter them by an Agile Release Train (ART) and Team. This provides a clear overview of all the Work Items assigned to a Team.
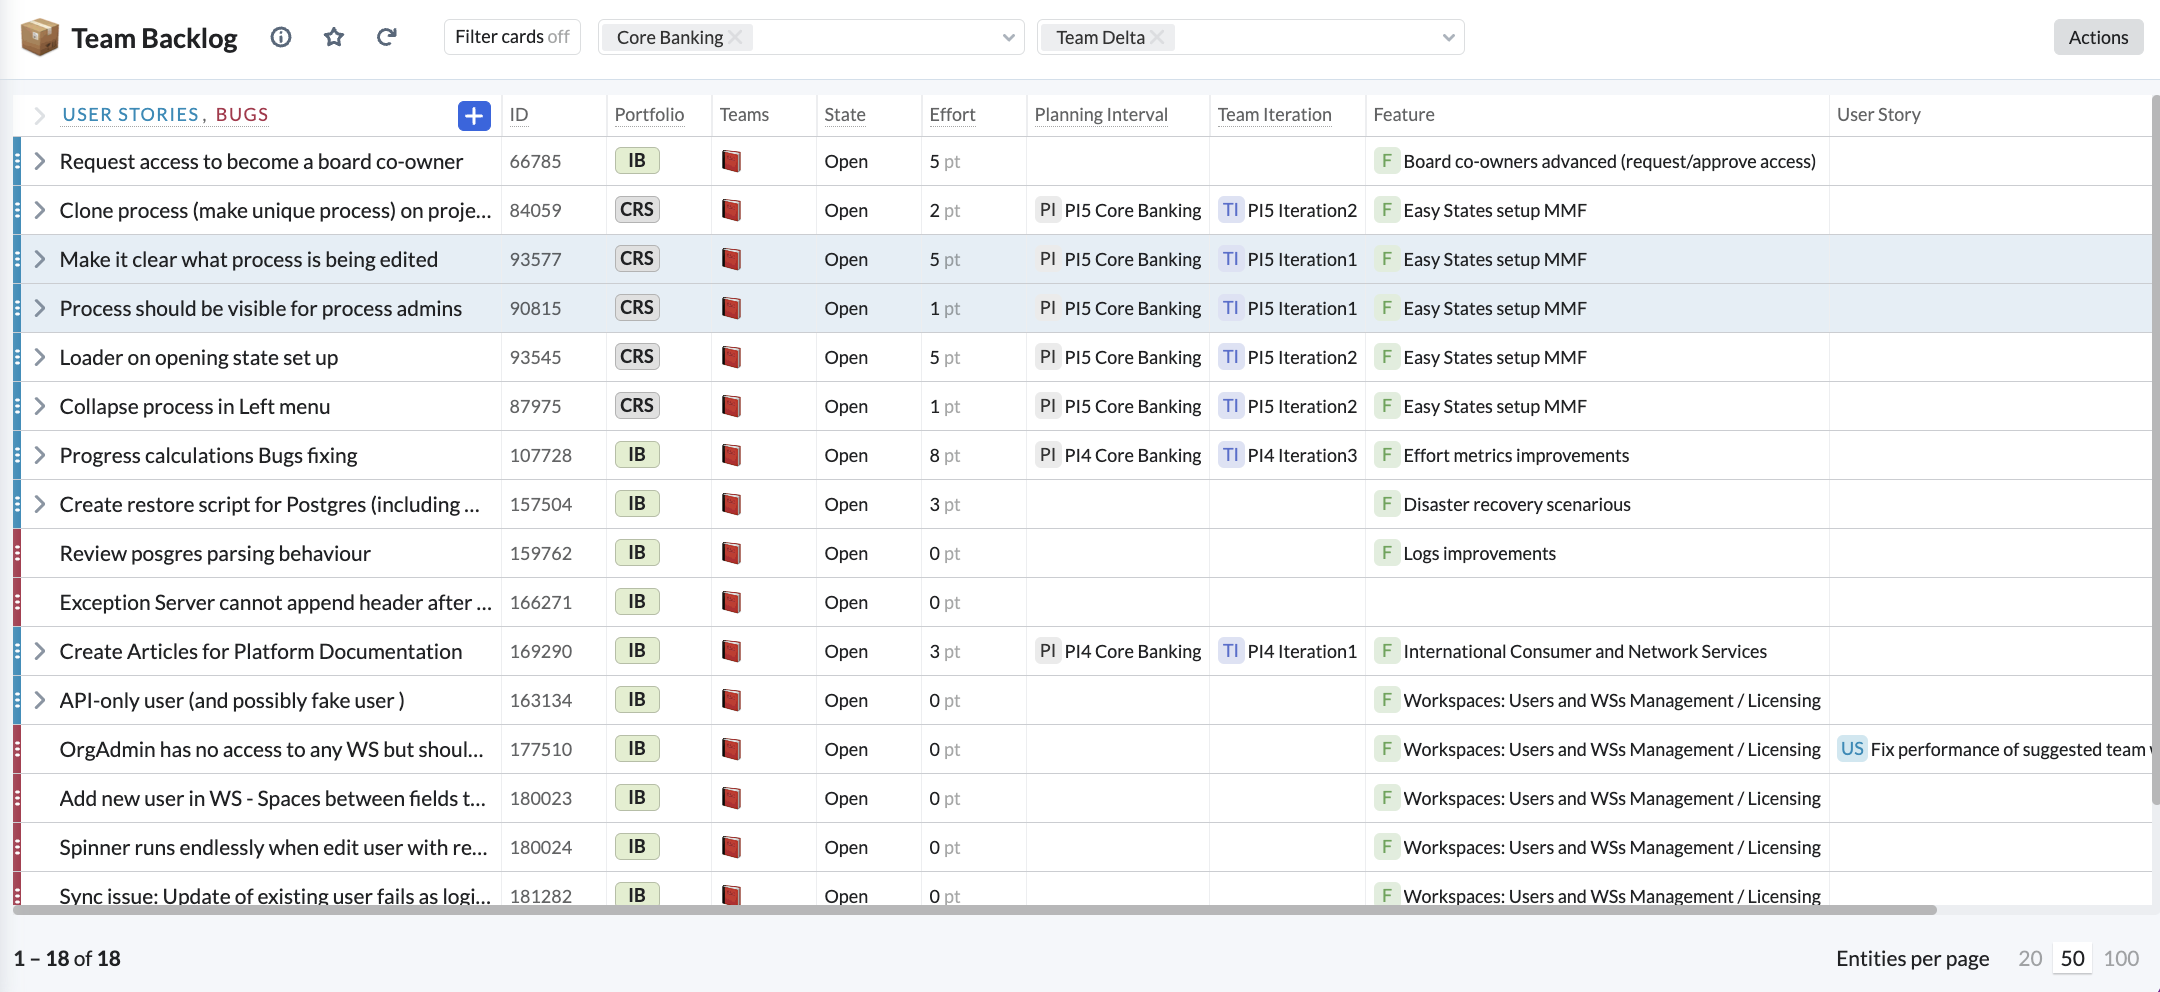
Team Backlog
Team Backlog contains upcoming work necessary for progress. On a Team Backlog view, you can see a prioritized list of not started User Stories and Bugs.
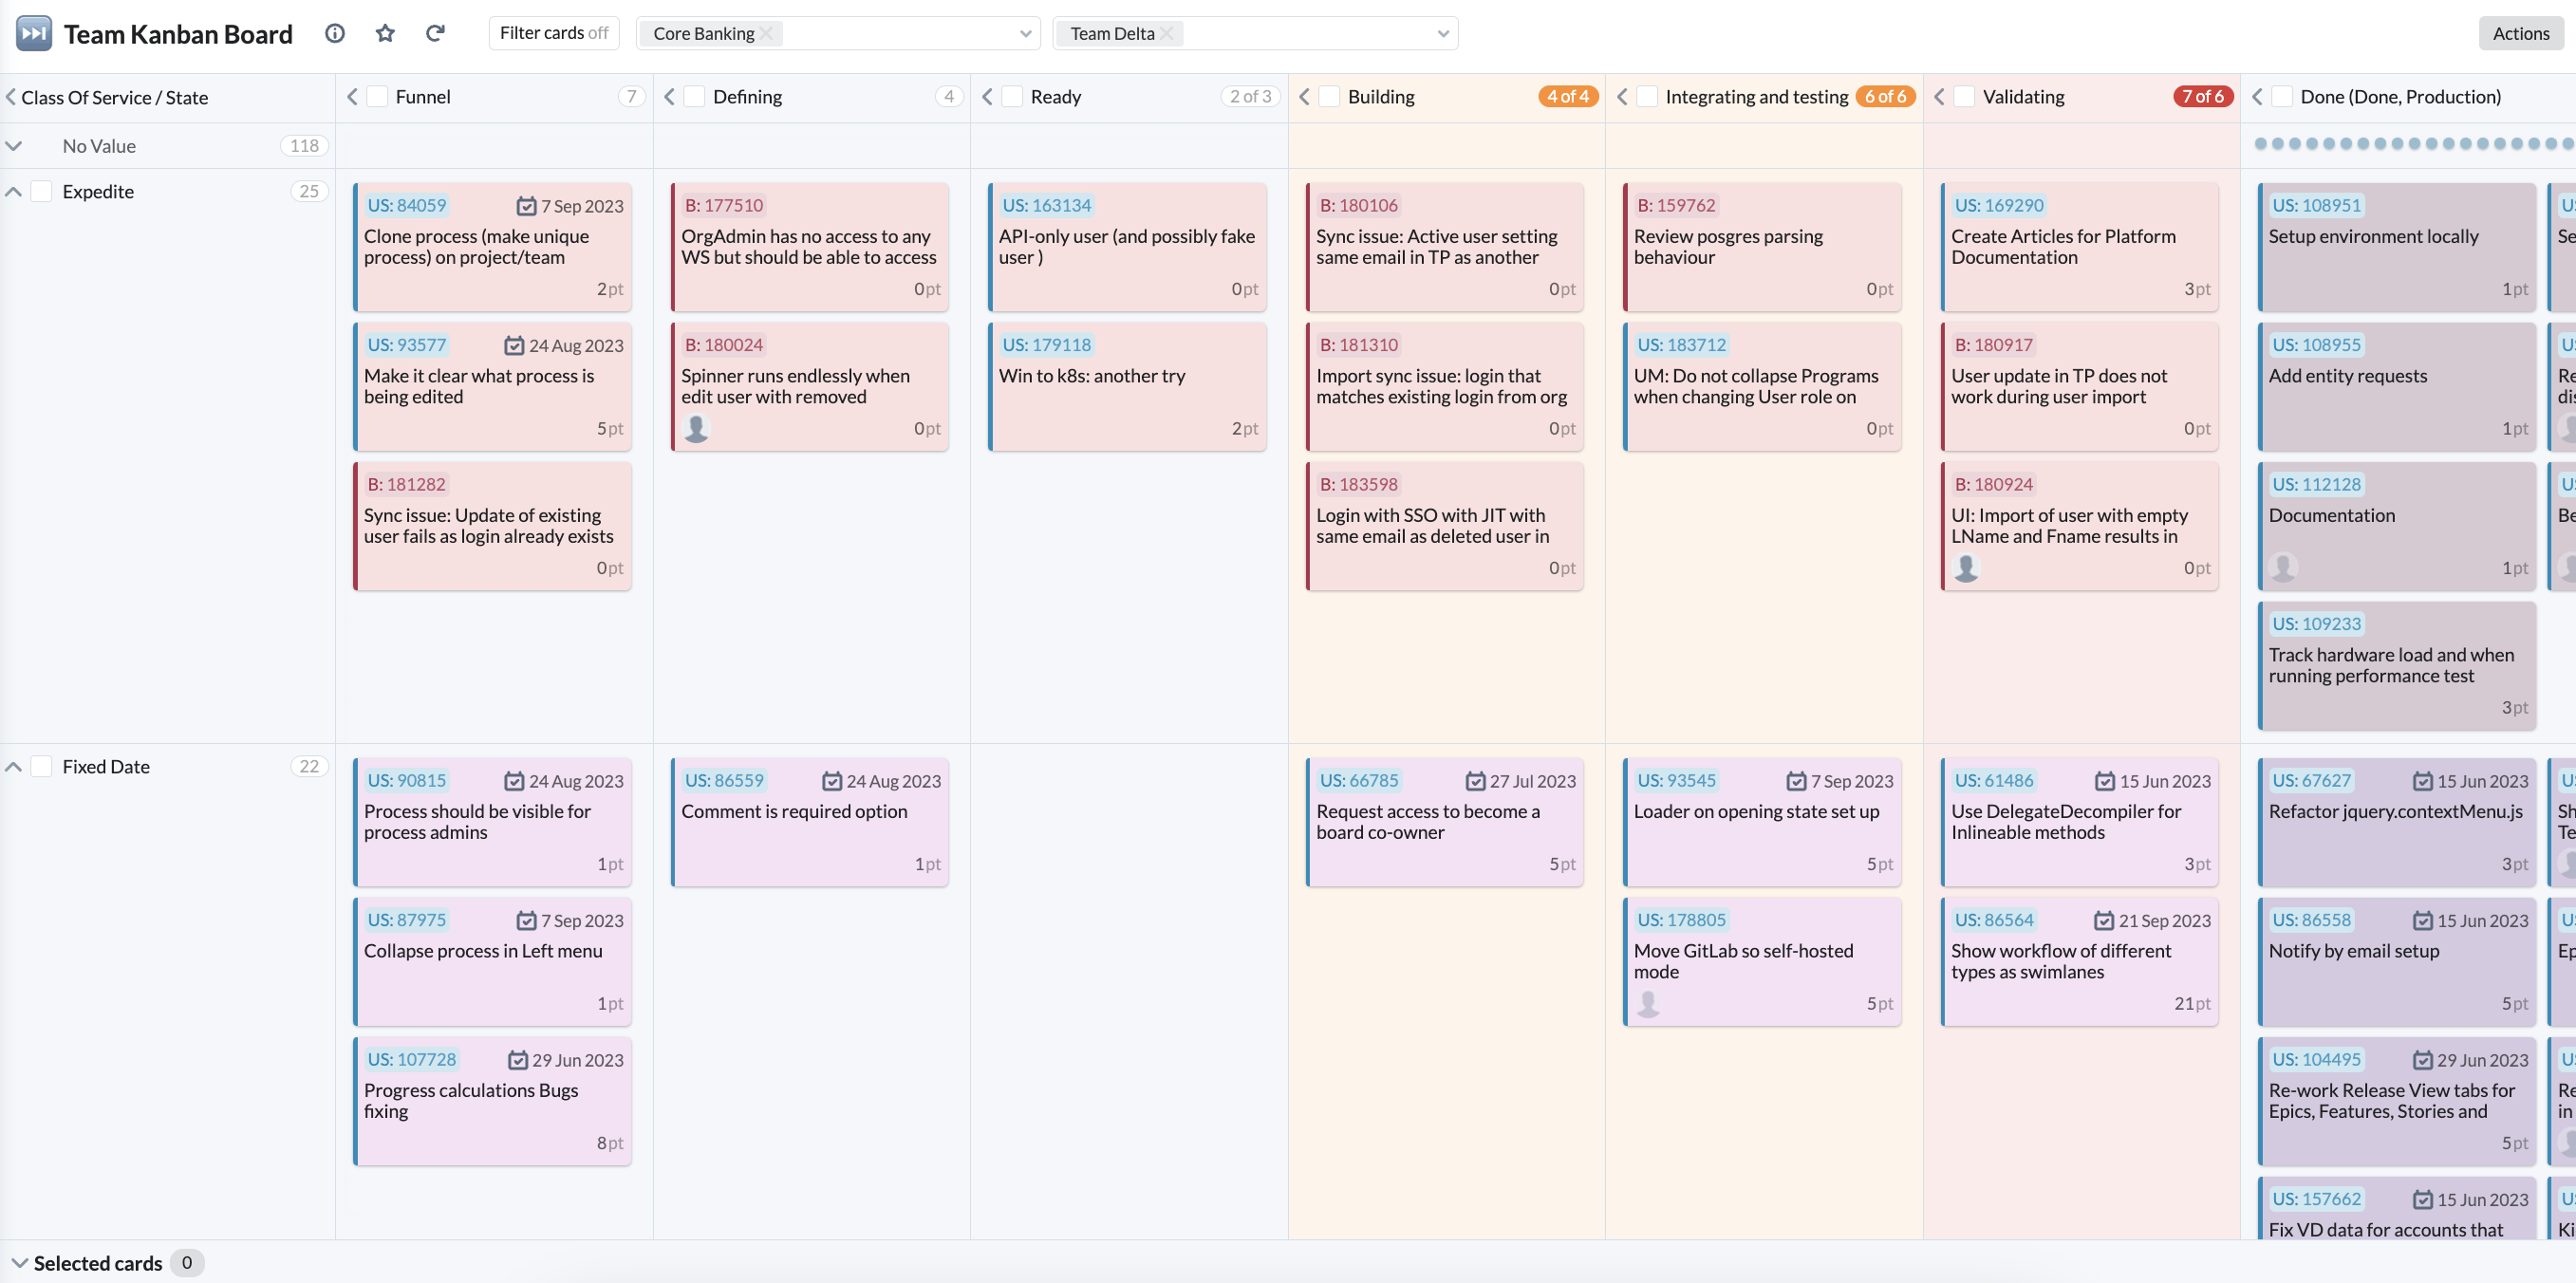
Team Kanban Board
The Team Kanban Board view displays the team's workflow and sets specific limits on the number of work items that can be in progress at each stage. It helps teams maintain focus, prevent overloading, and improve overall efficiency by ensuring that work items are completed before new ones are started.
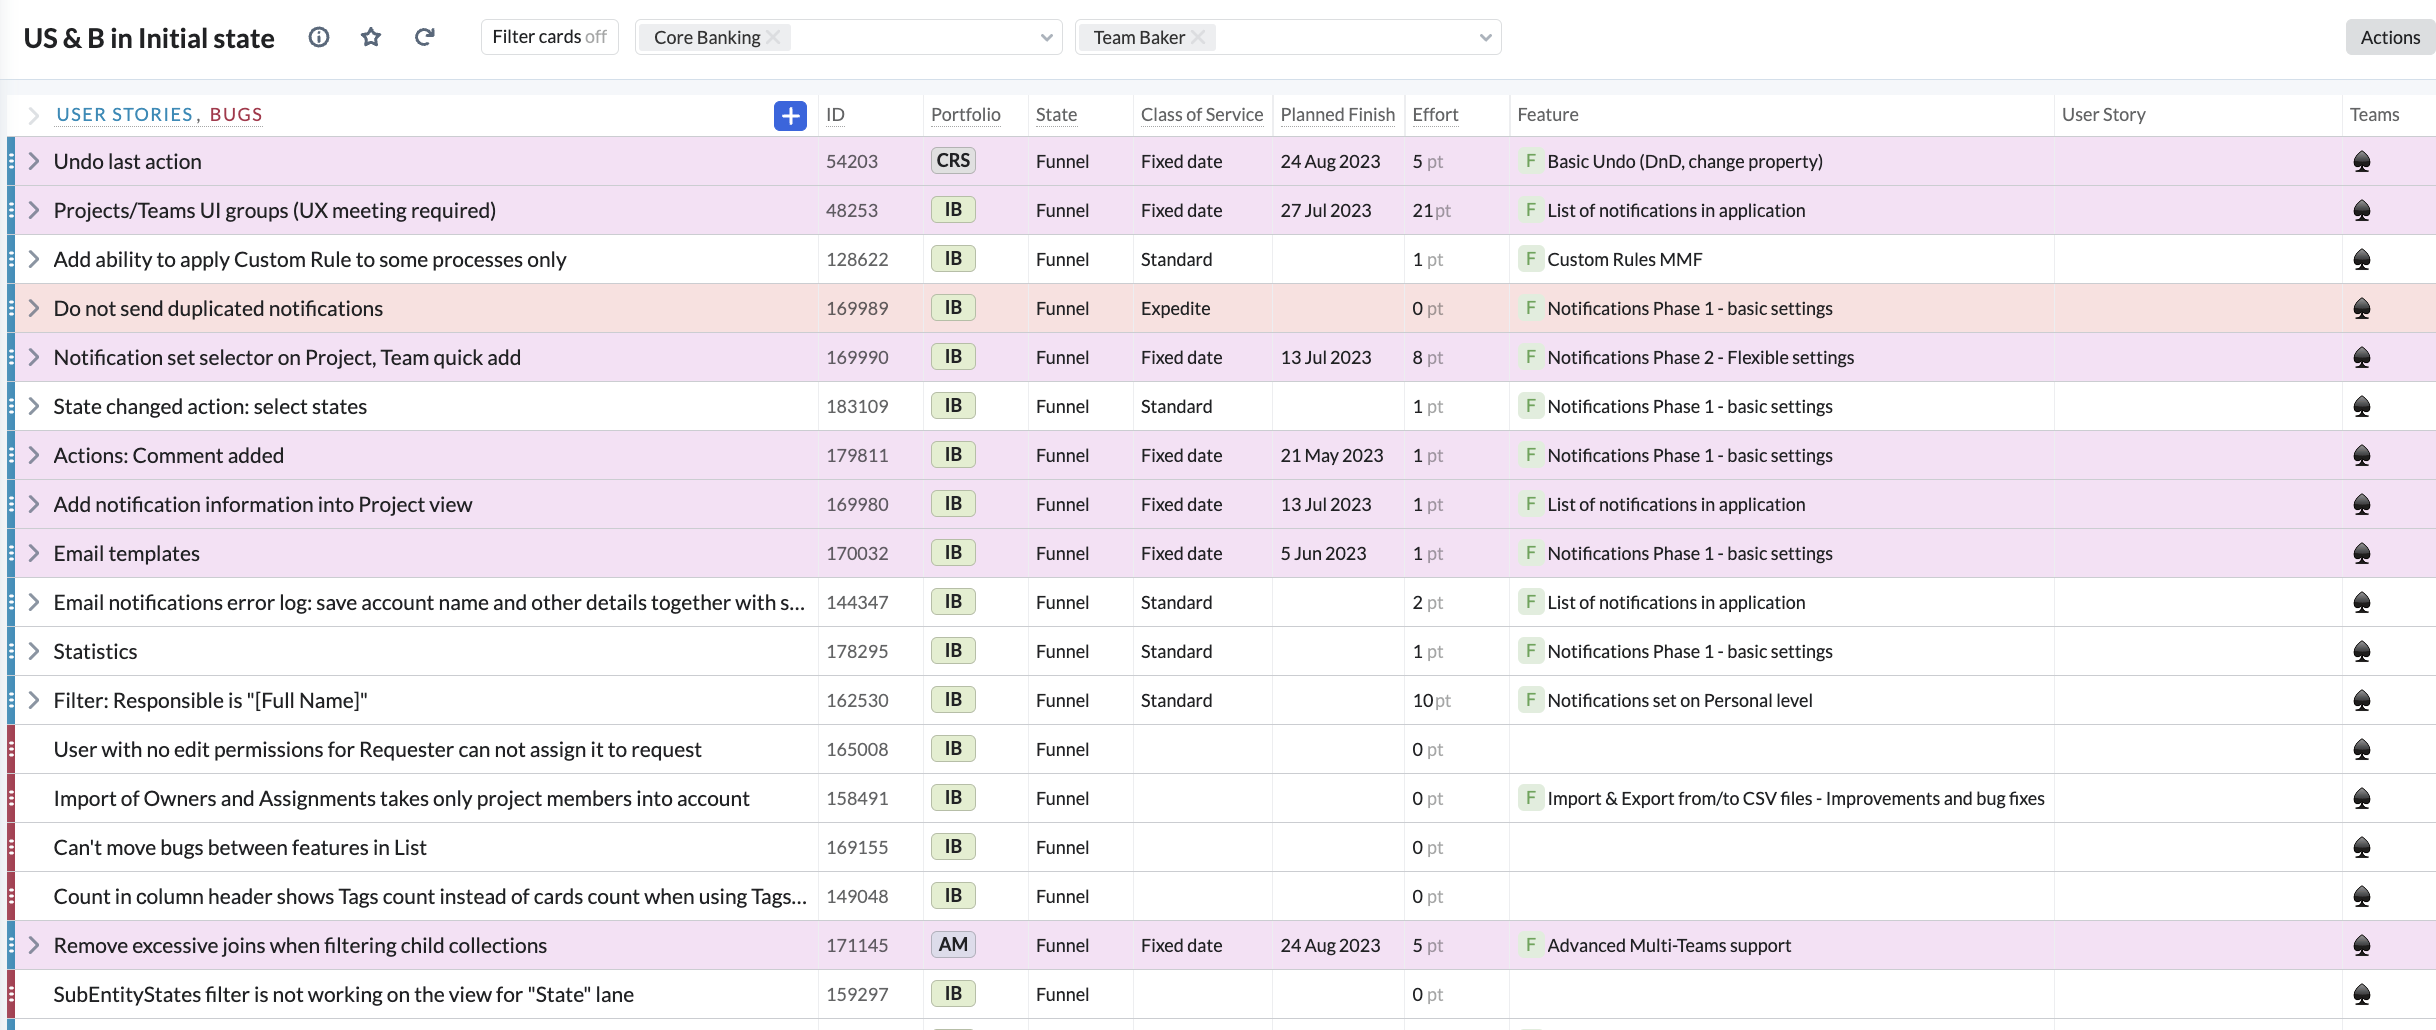
US & B in Initial state
The view of US (User Stories) & B (Bugs) in the initial state displays all the User Stories and Bugs that are currently in their initial state. These are the items that have not yet been picked up or worked on by the team and are awaiting assignment and progress.
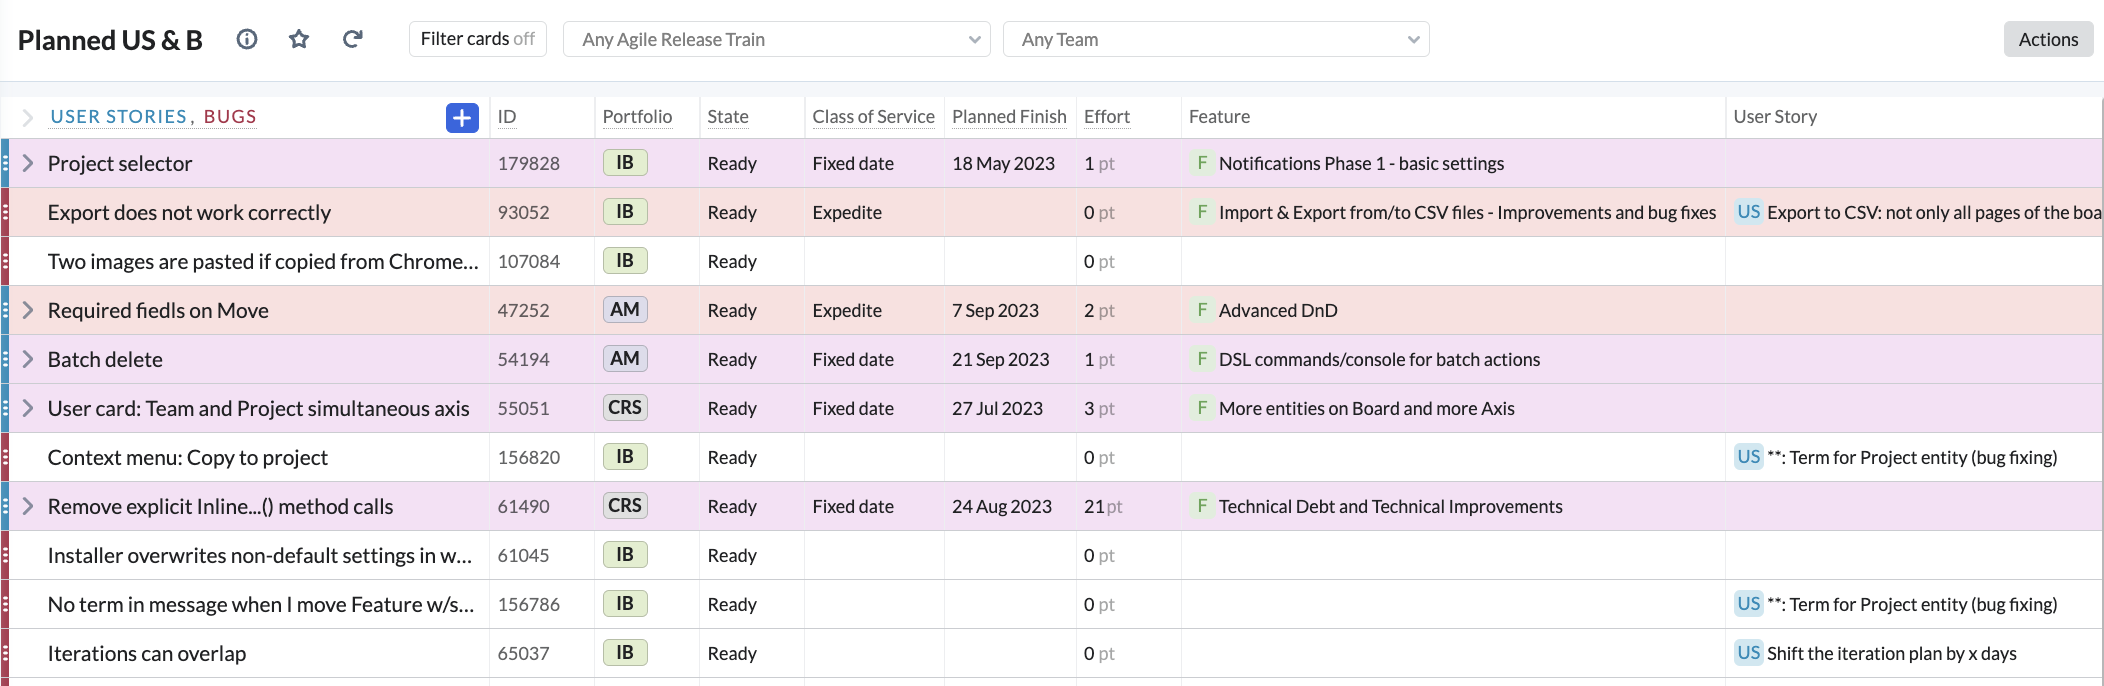
Planned US & B
The view of US (User Stories) & B (Bugs) in the planned state displays all the User Stories and Bugs that have been planned for a specific iteration or time period. These are the items that the team has committed to work on during the upcoming sprint or iteration.
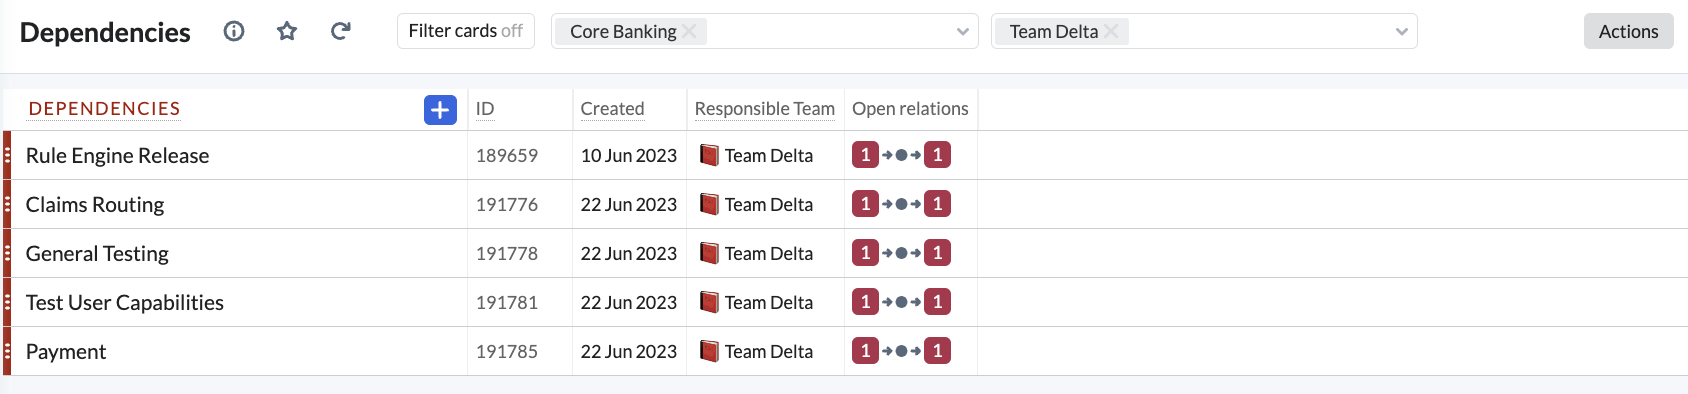
Dependencies
The list of Dependencies shows the interconnections between Tasks, User Stories, or Bugs that rely on each other, and it is needed in the daily team sync to identify potential obstacles, coordinate efforts, and ensure smooth progress in completing the work.
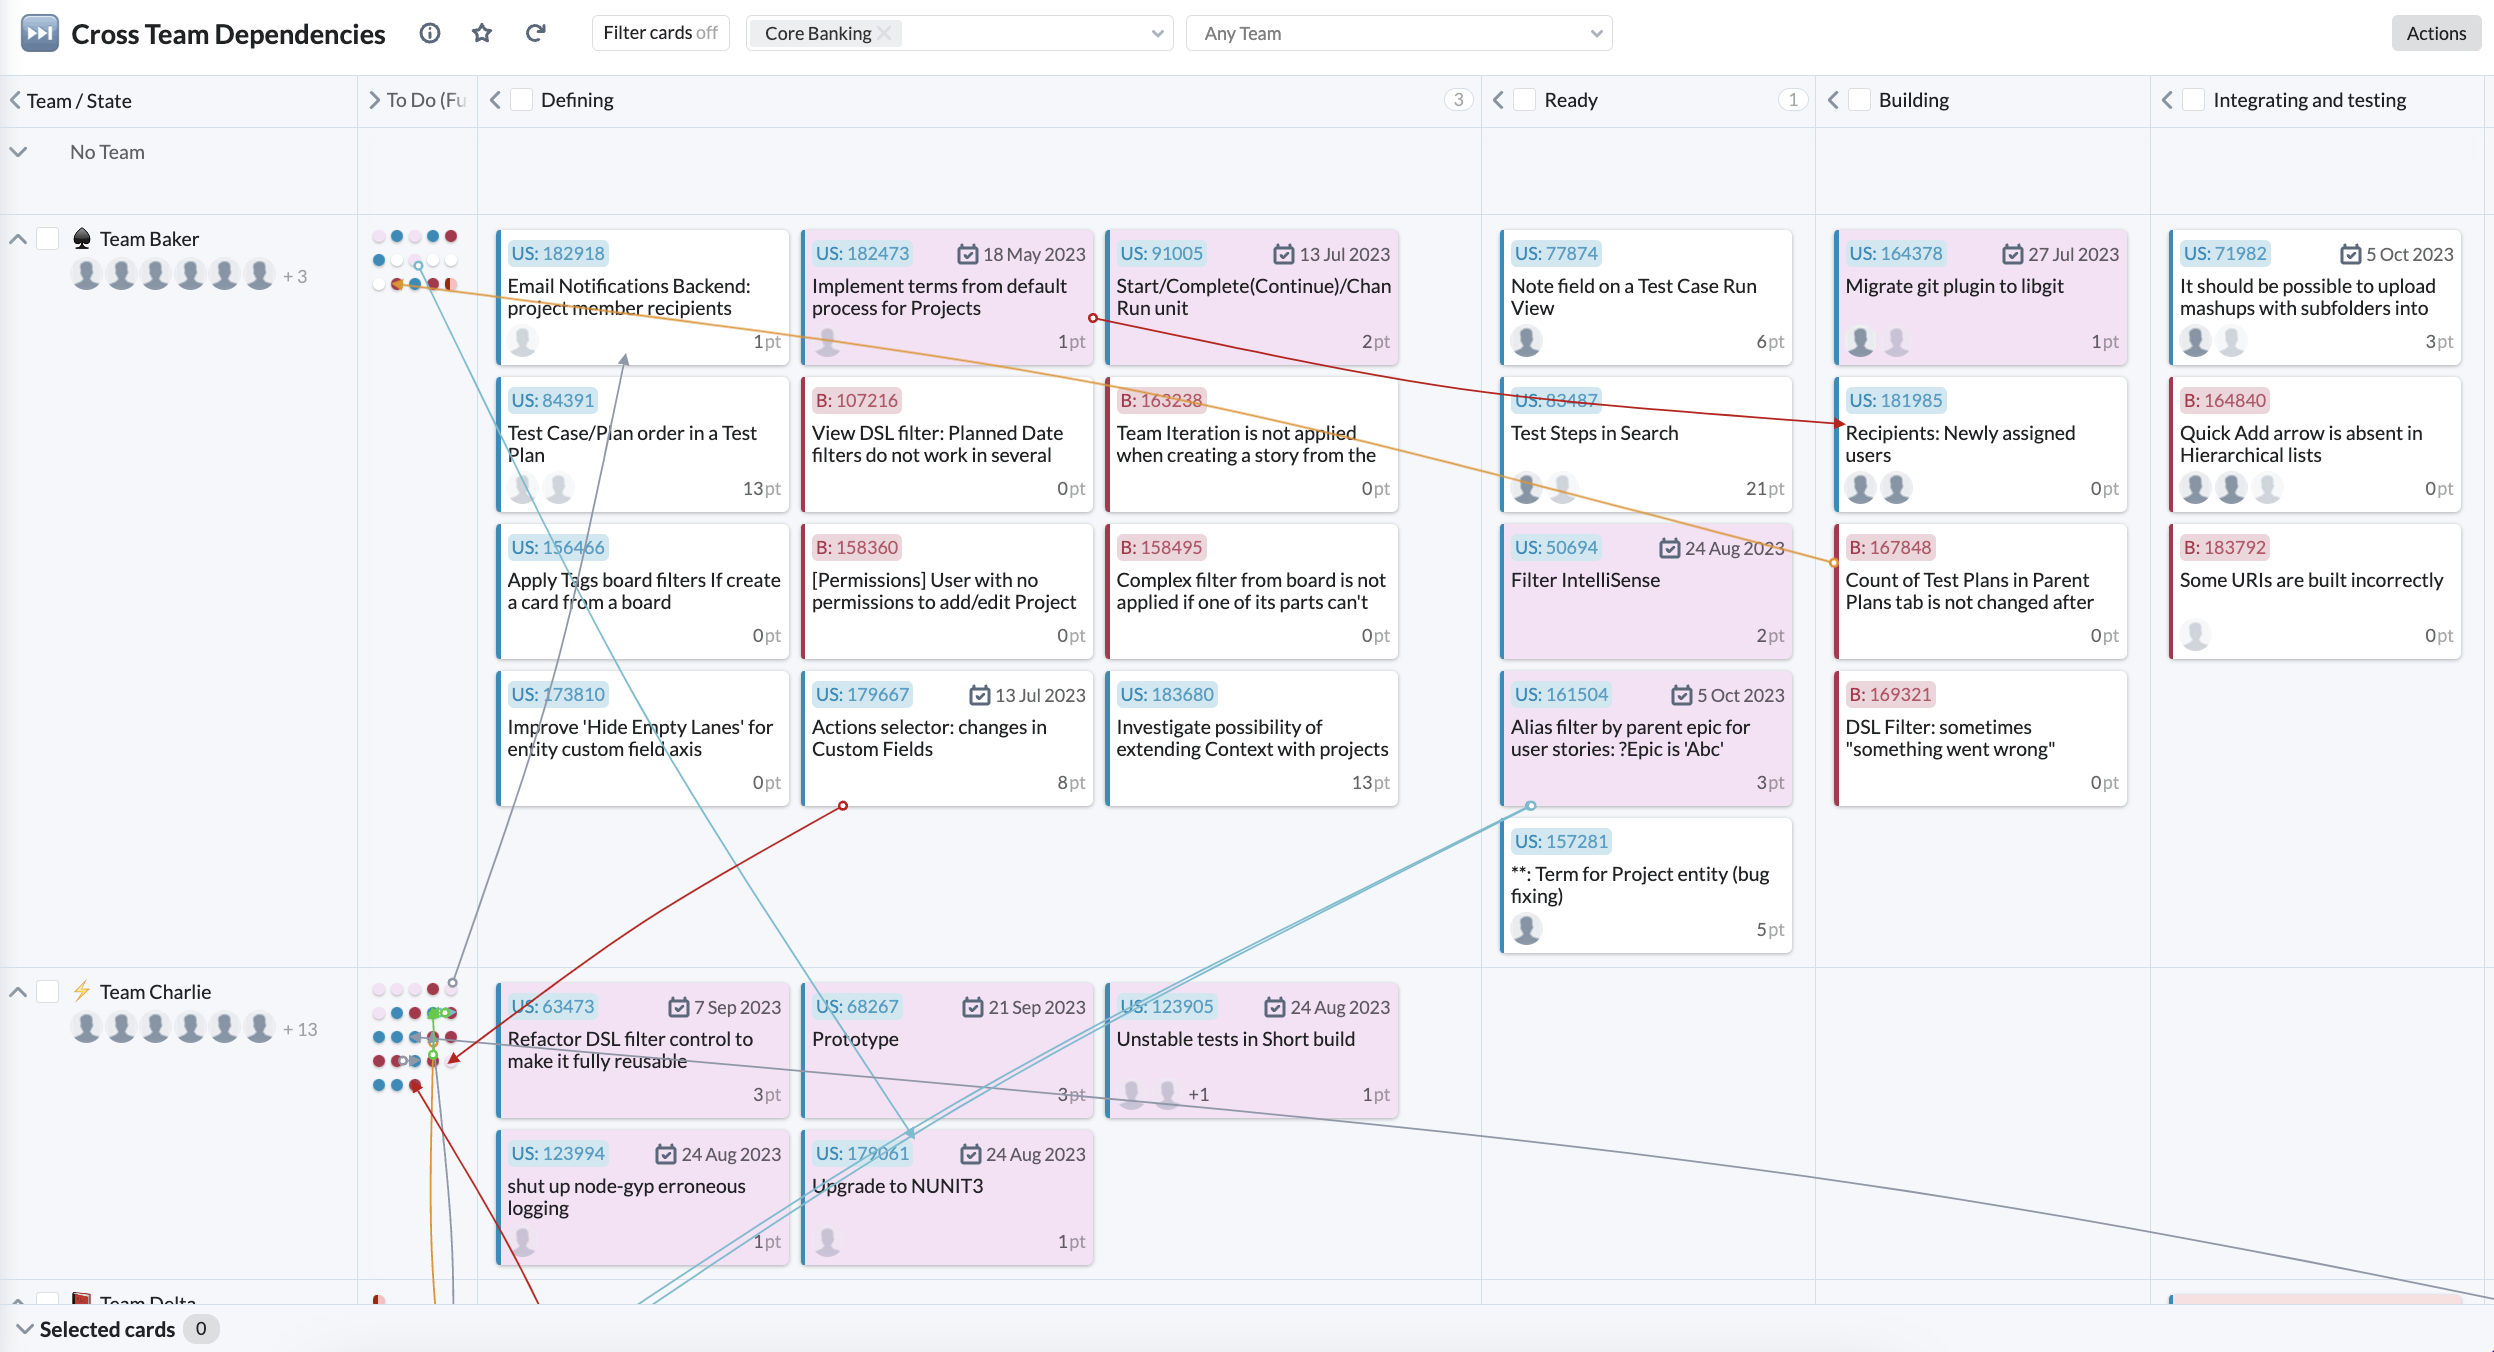
Cross Team Dependencies
The Cross Team Dependencies board is essential for visualizing and managing Dependencies between Teams, ensuring better coordination, proactive issue resolution, and improved decision-making in large-scale Agile development environments.
Kanban Dashboard
The Kanban Dashboard integrates various Kanban views and metrics, offering a comprehensive and customizable overview of team and project performance, and facilitating better planning, decision-making, and continuous improvement.
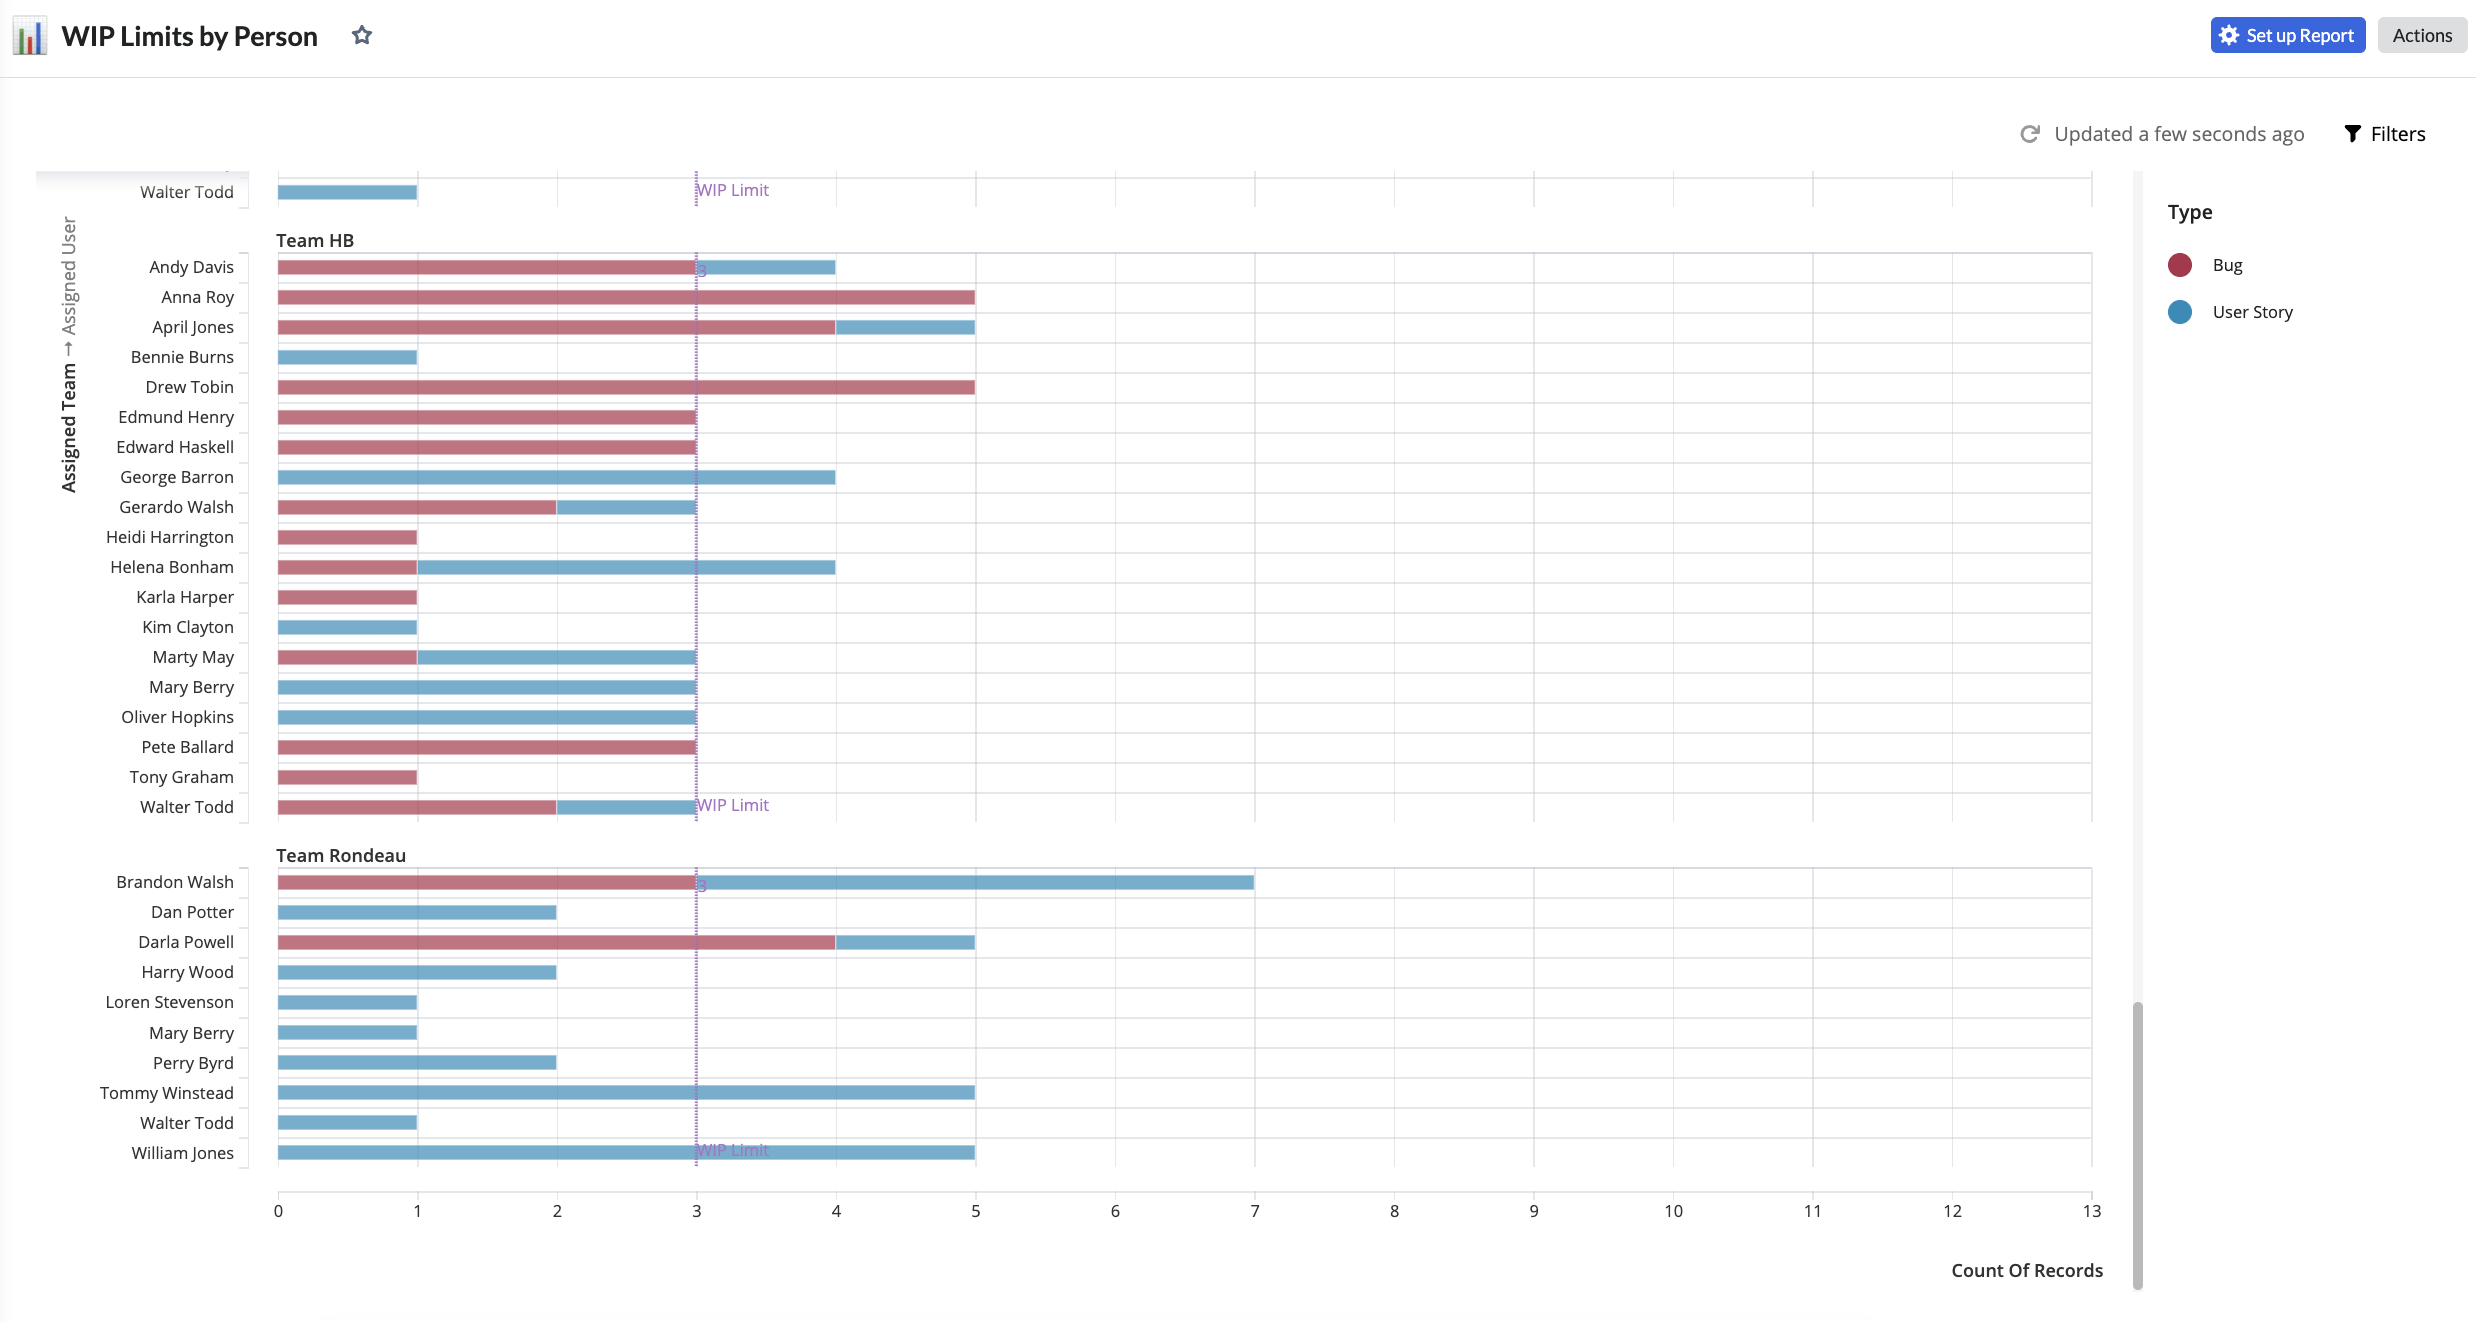
WIP Limits by Person
WIP (Work in Progress) Limits by Person allows teams to set and see the limits on the number of User Stories and Bugs each team member can work on simultaneously, helping maintain focus, improve collaboration, and prevent overloading team members.
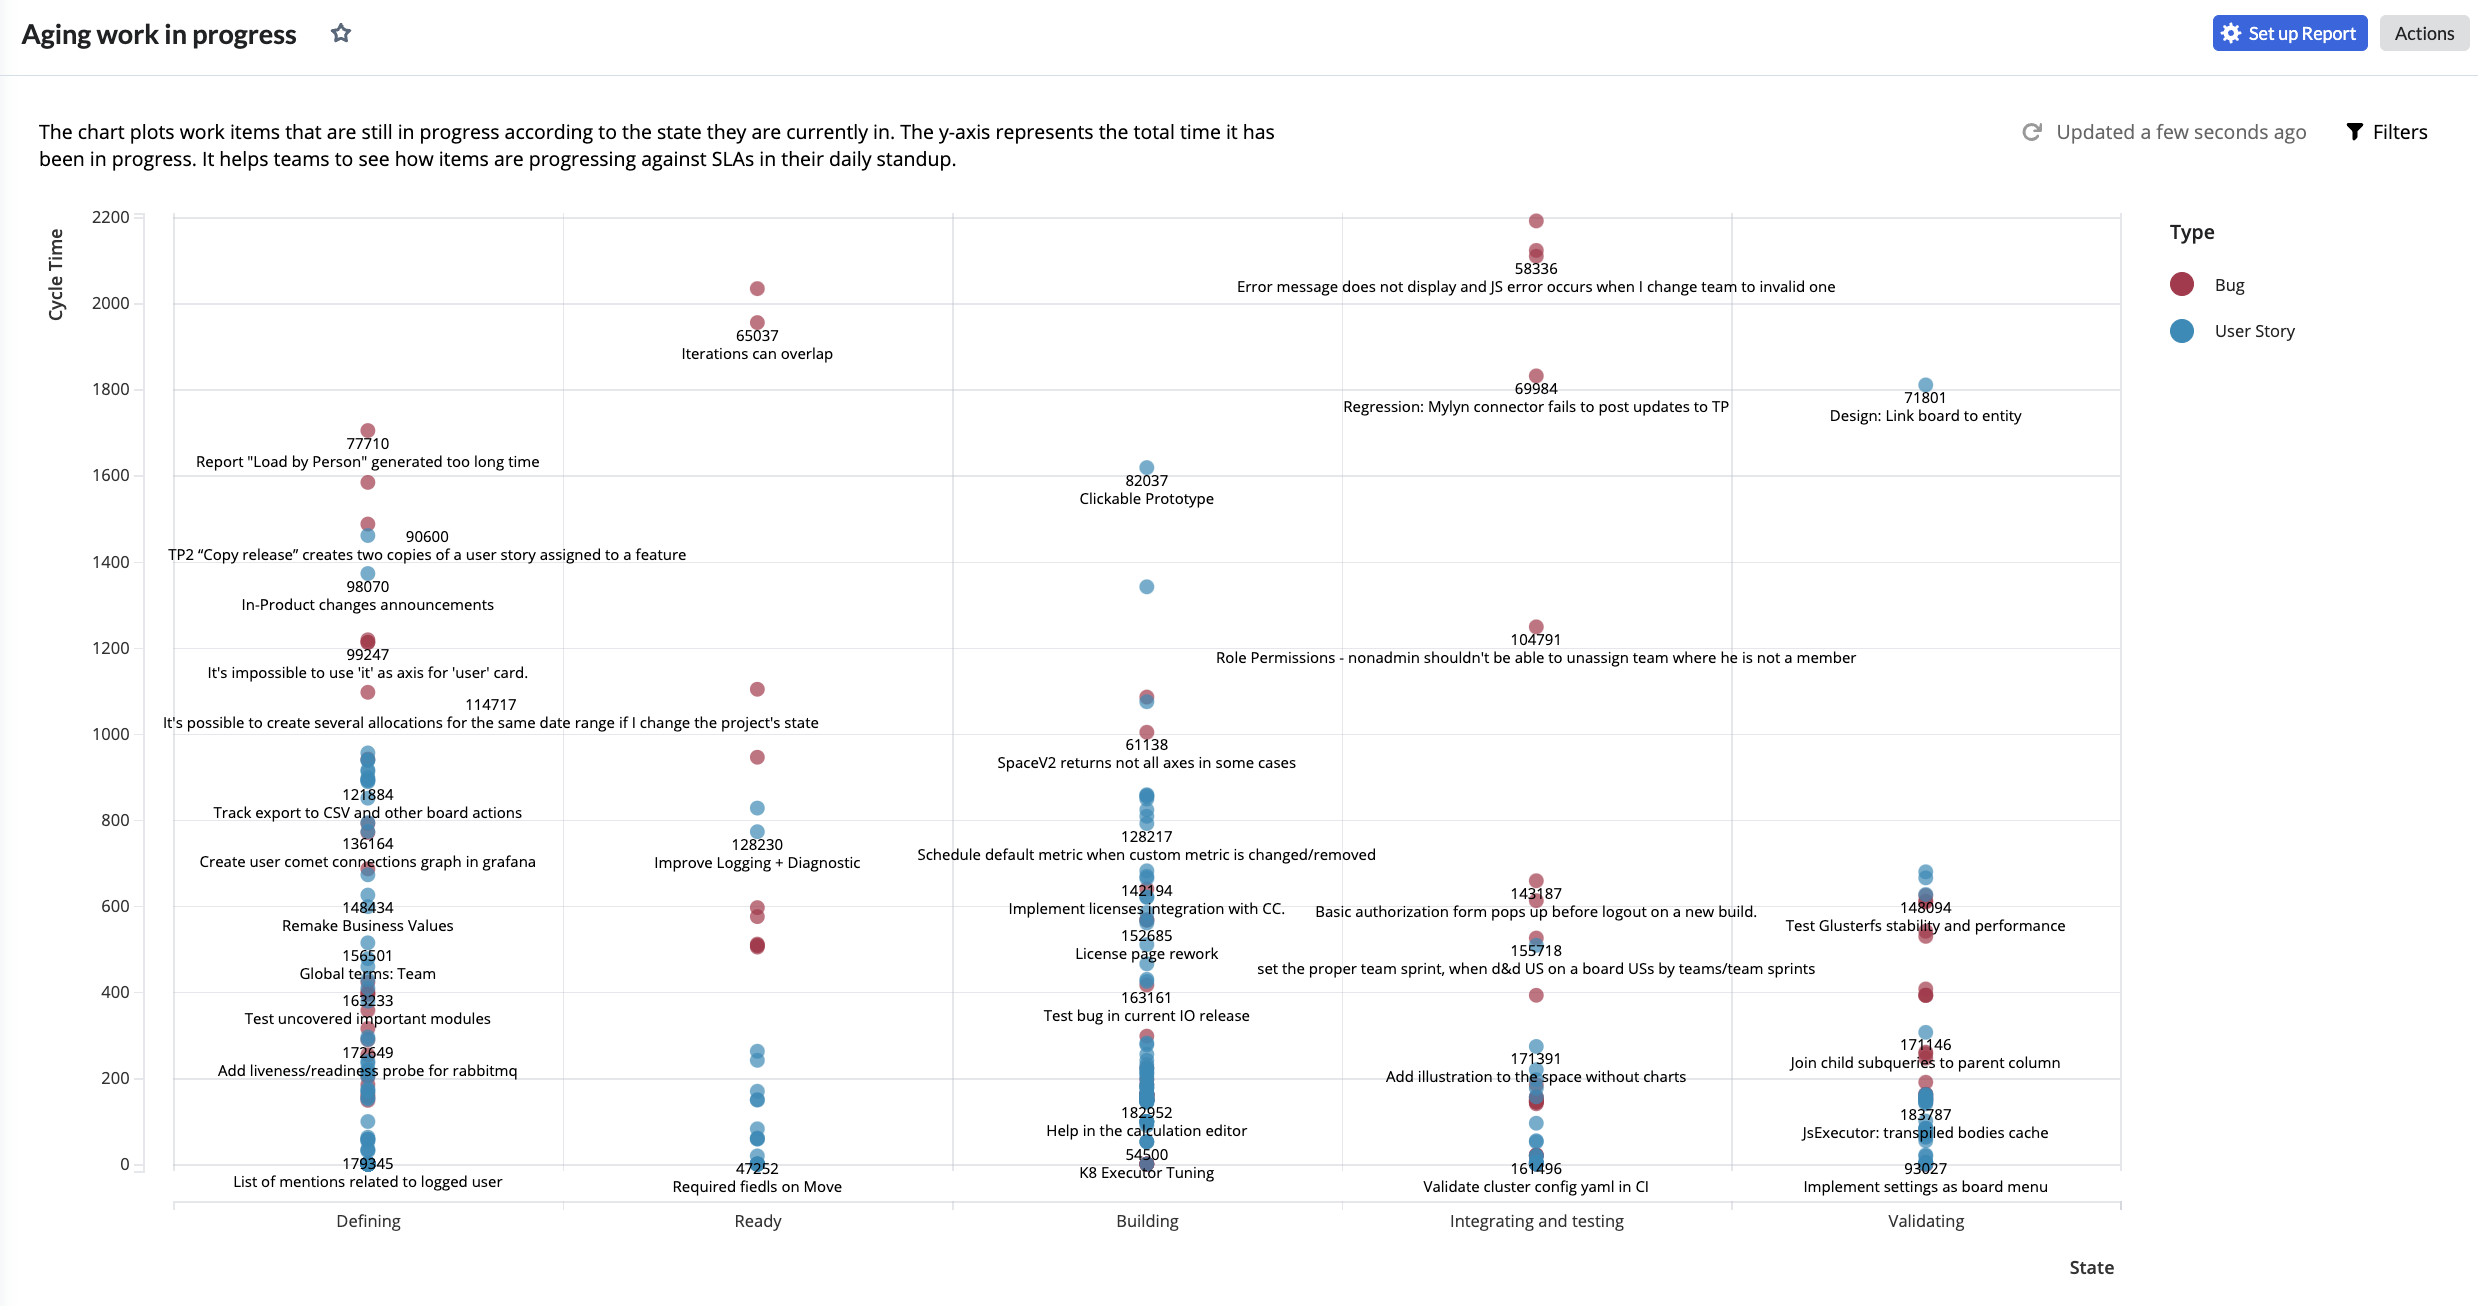
Aging Work in Progress
The Aging Work in Progress view highlights the age of tasks in progress, helping teams identify and address stalled or long-running items to maintain steady progress and timely delivery.
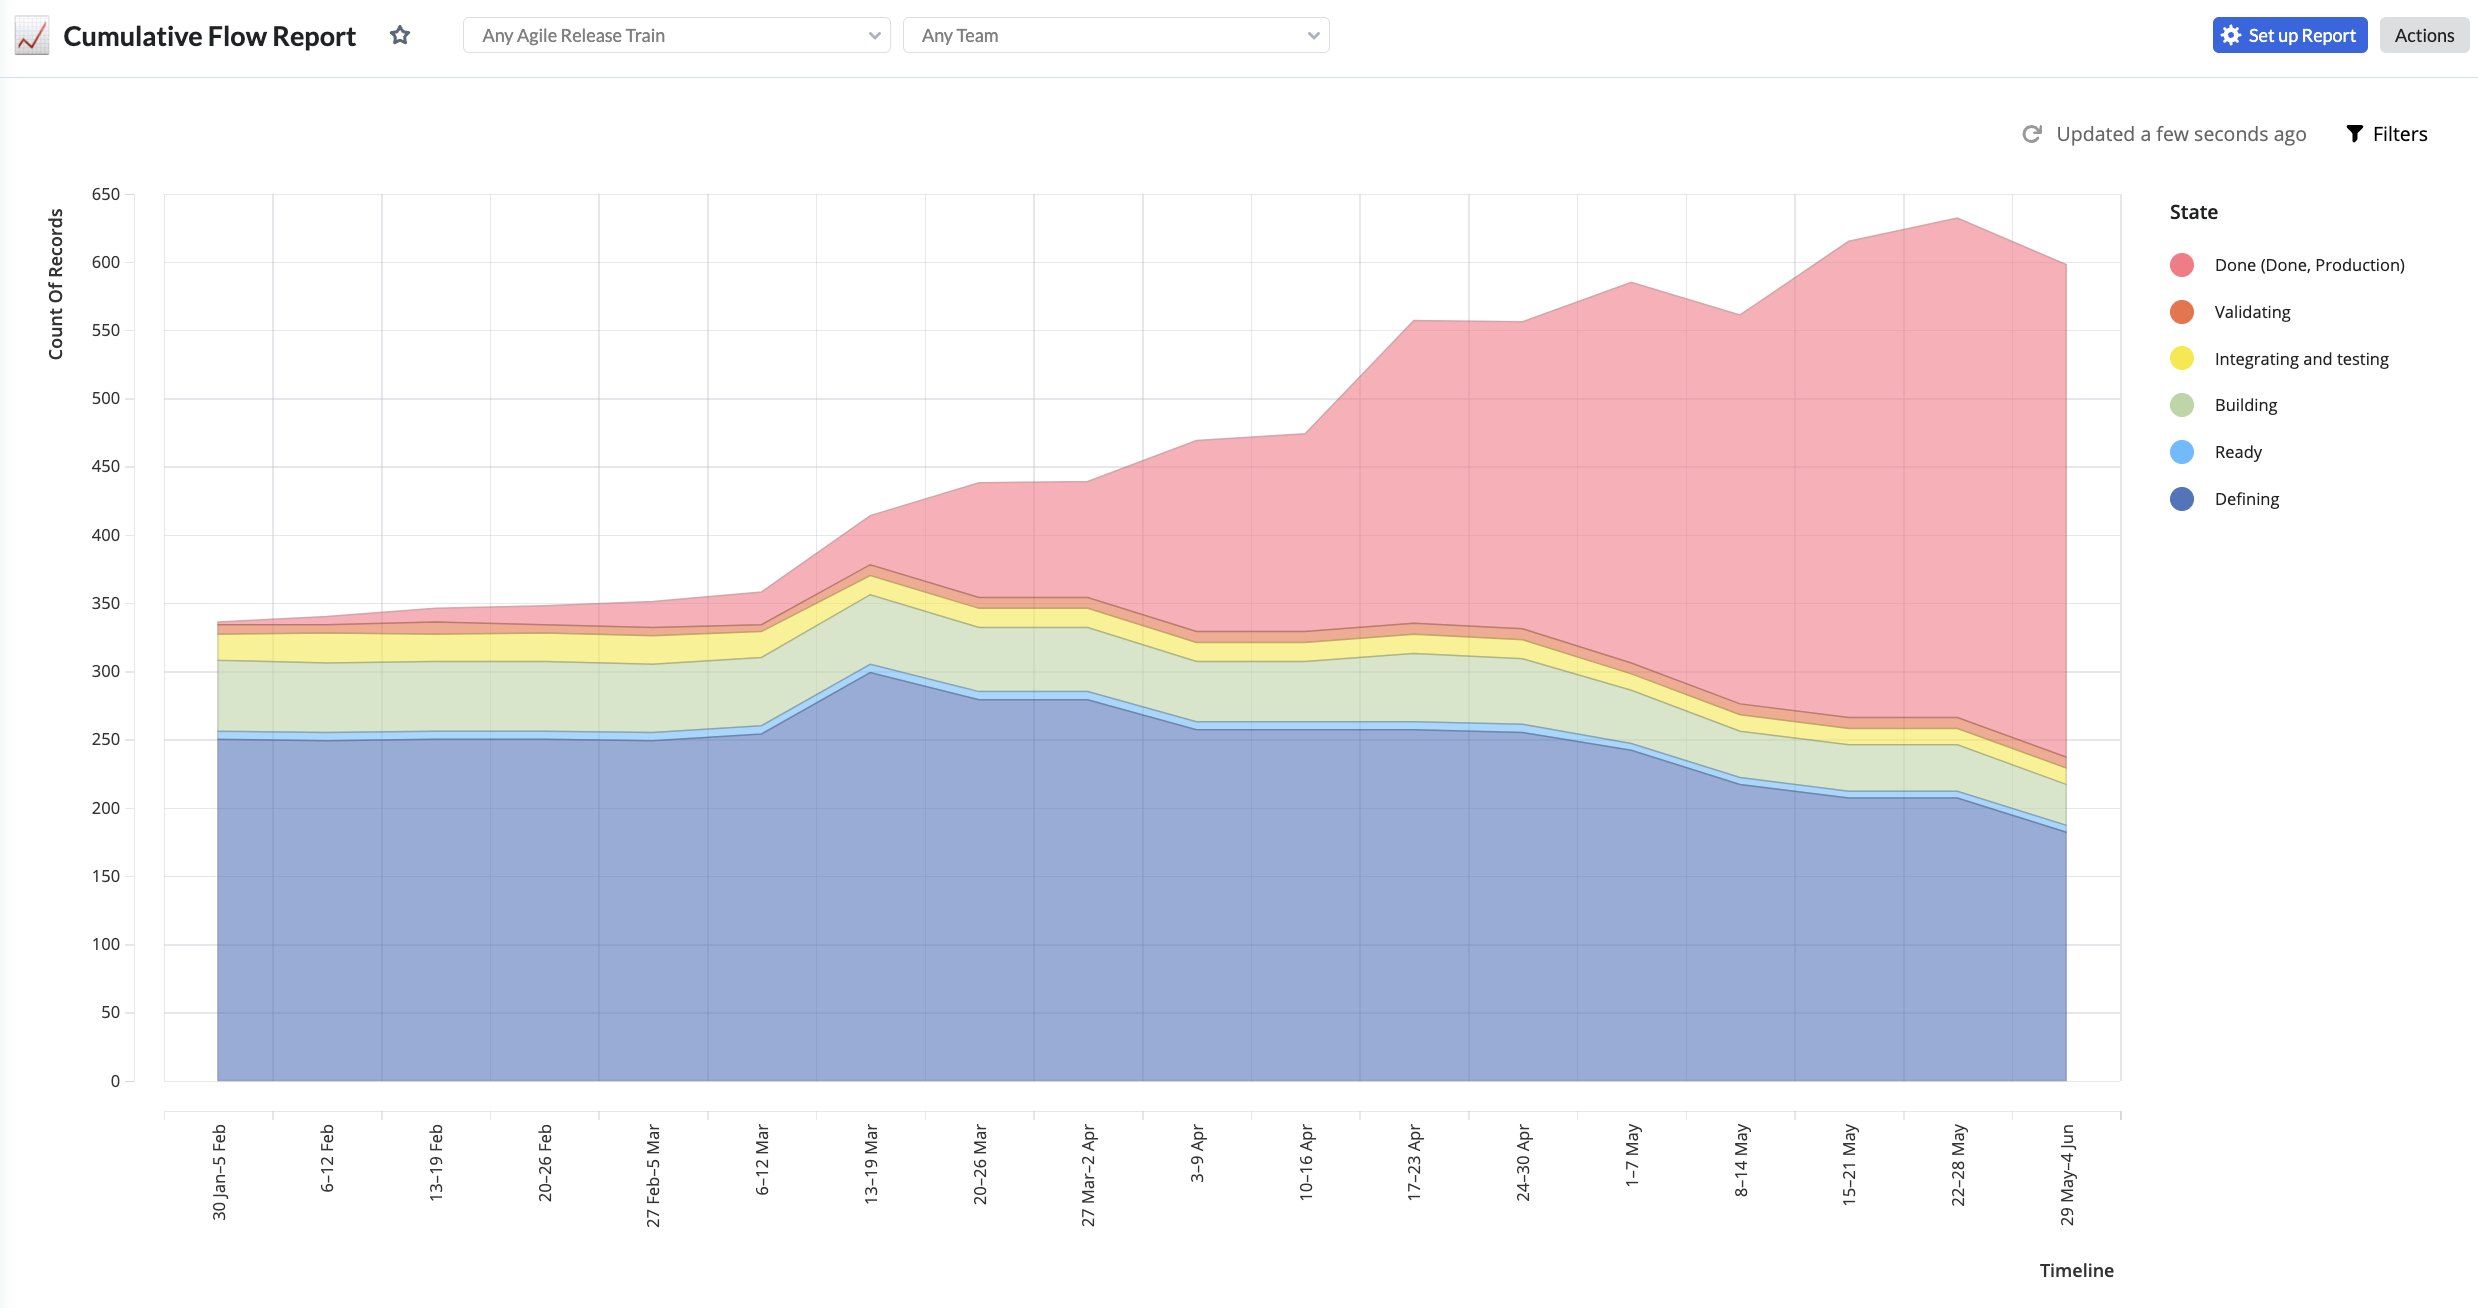
Cumulative Flow Report
The Cumulative Flow Report presents a graphical representation of work items' flow through various stages over time, enabling teams to analyze process efficiency and spot trends for continuous improvement.
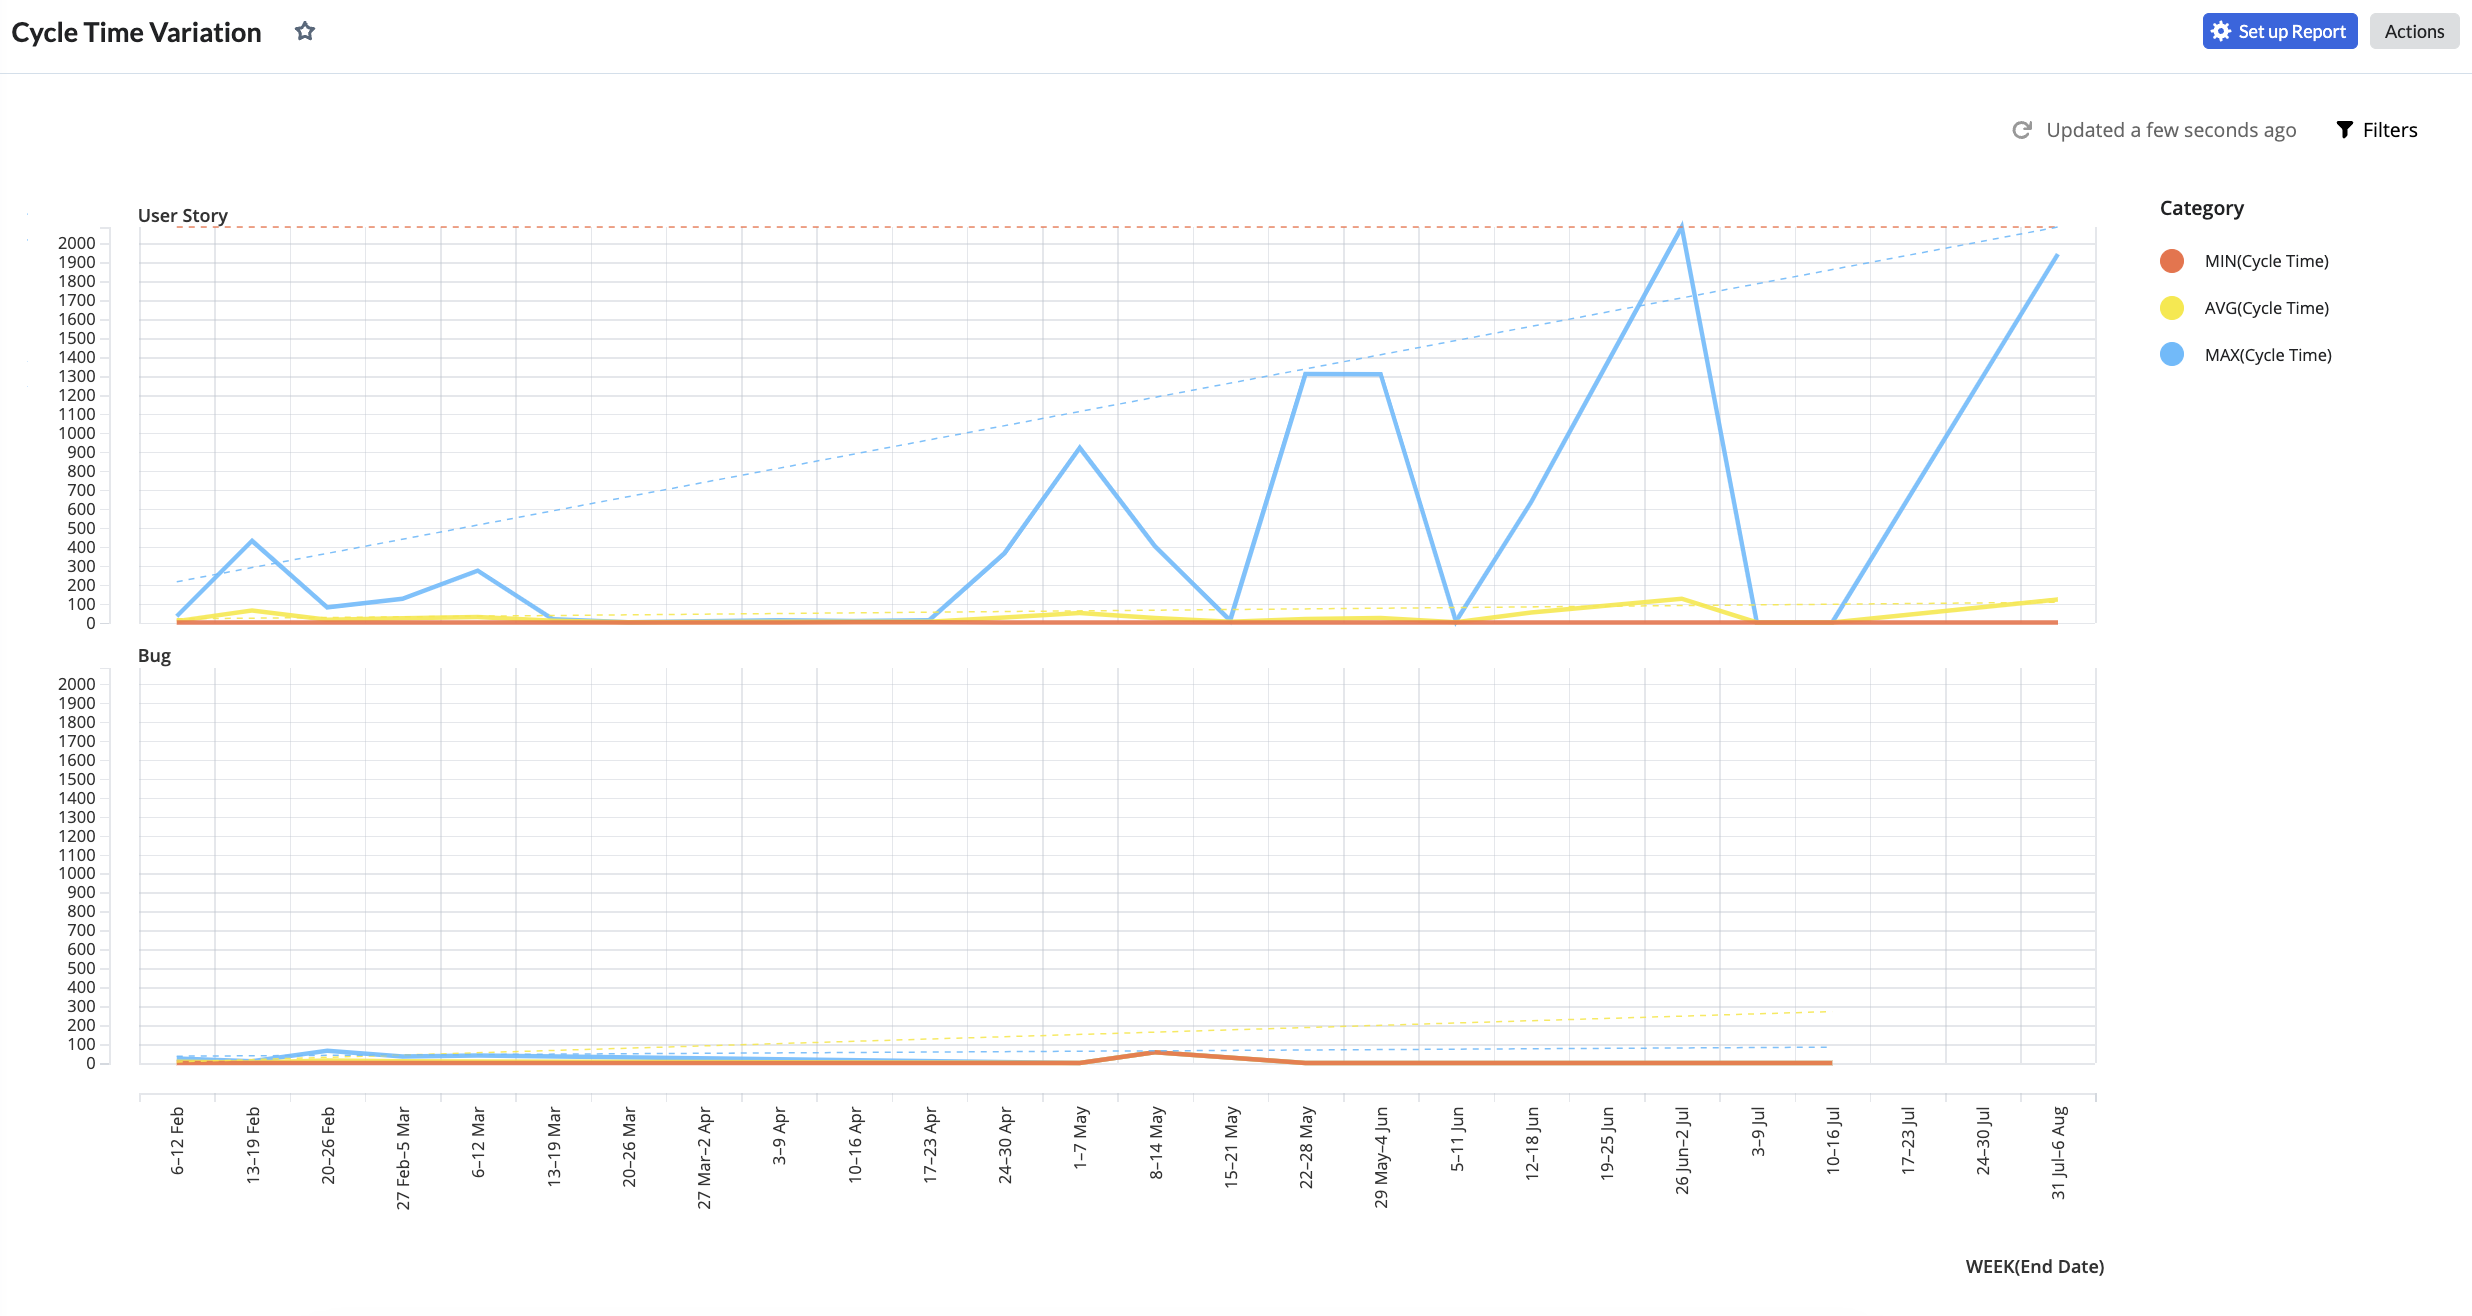
Cycle Time Variation
Cycle Time Variation shows the differences in the time taken to complete similar tasks, helping teams identify outliers and improve predictability and consistency in their delivery process.
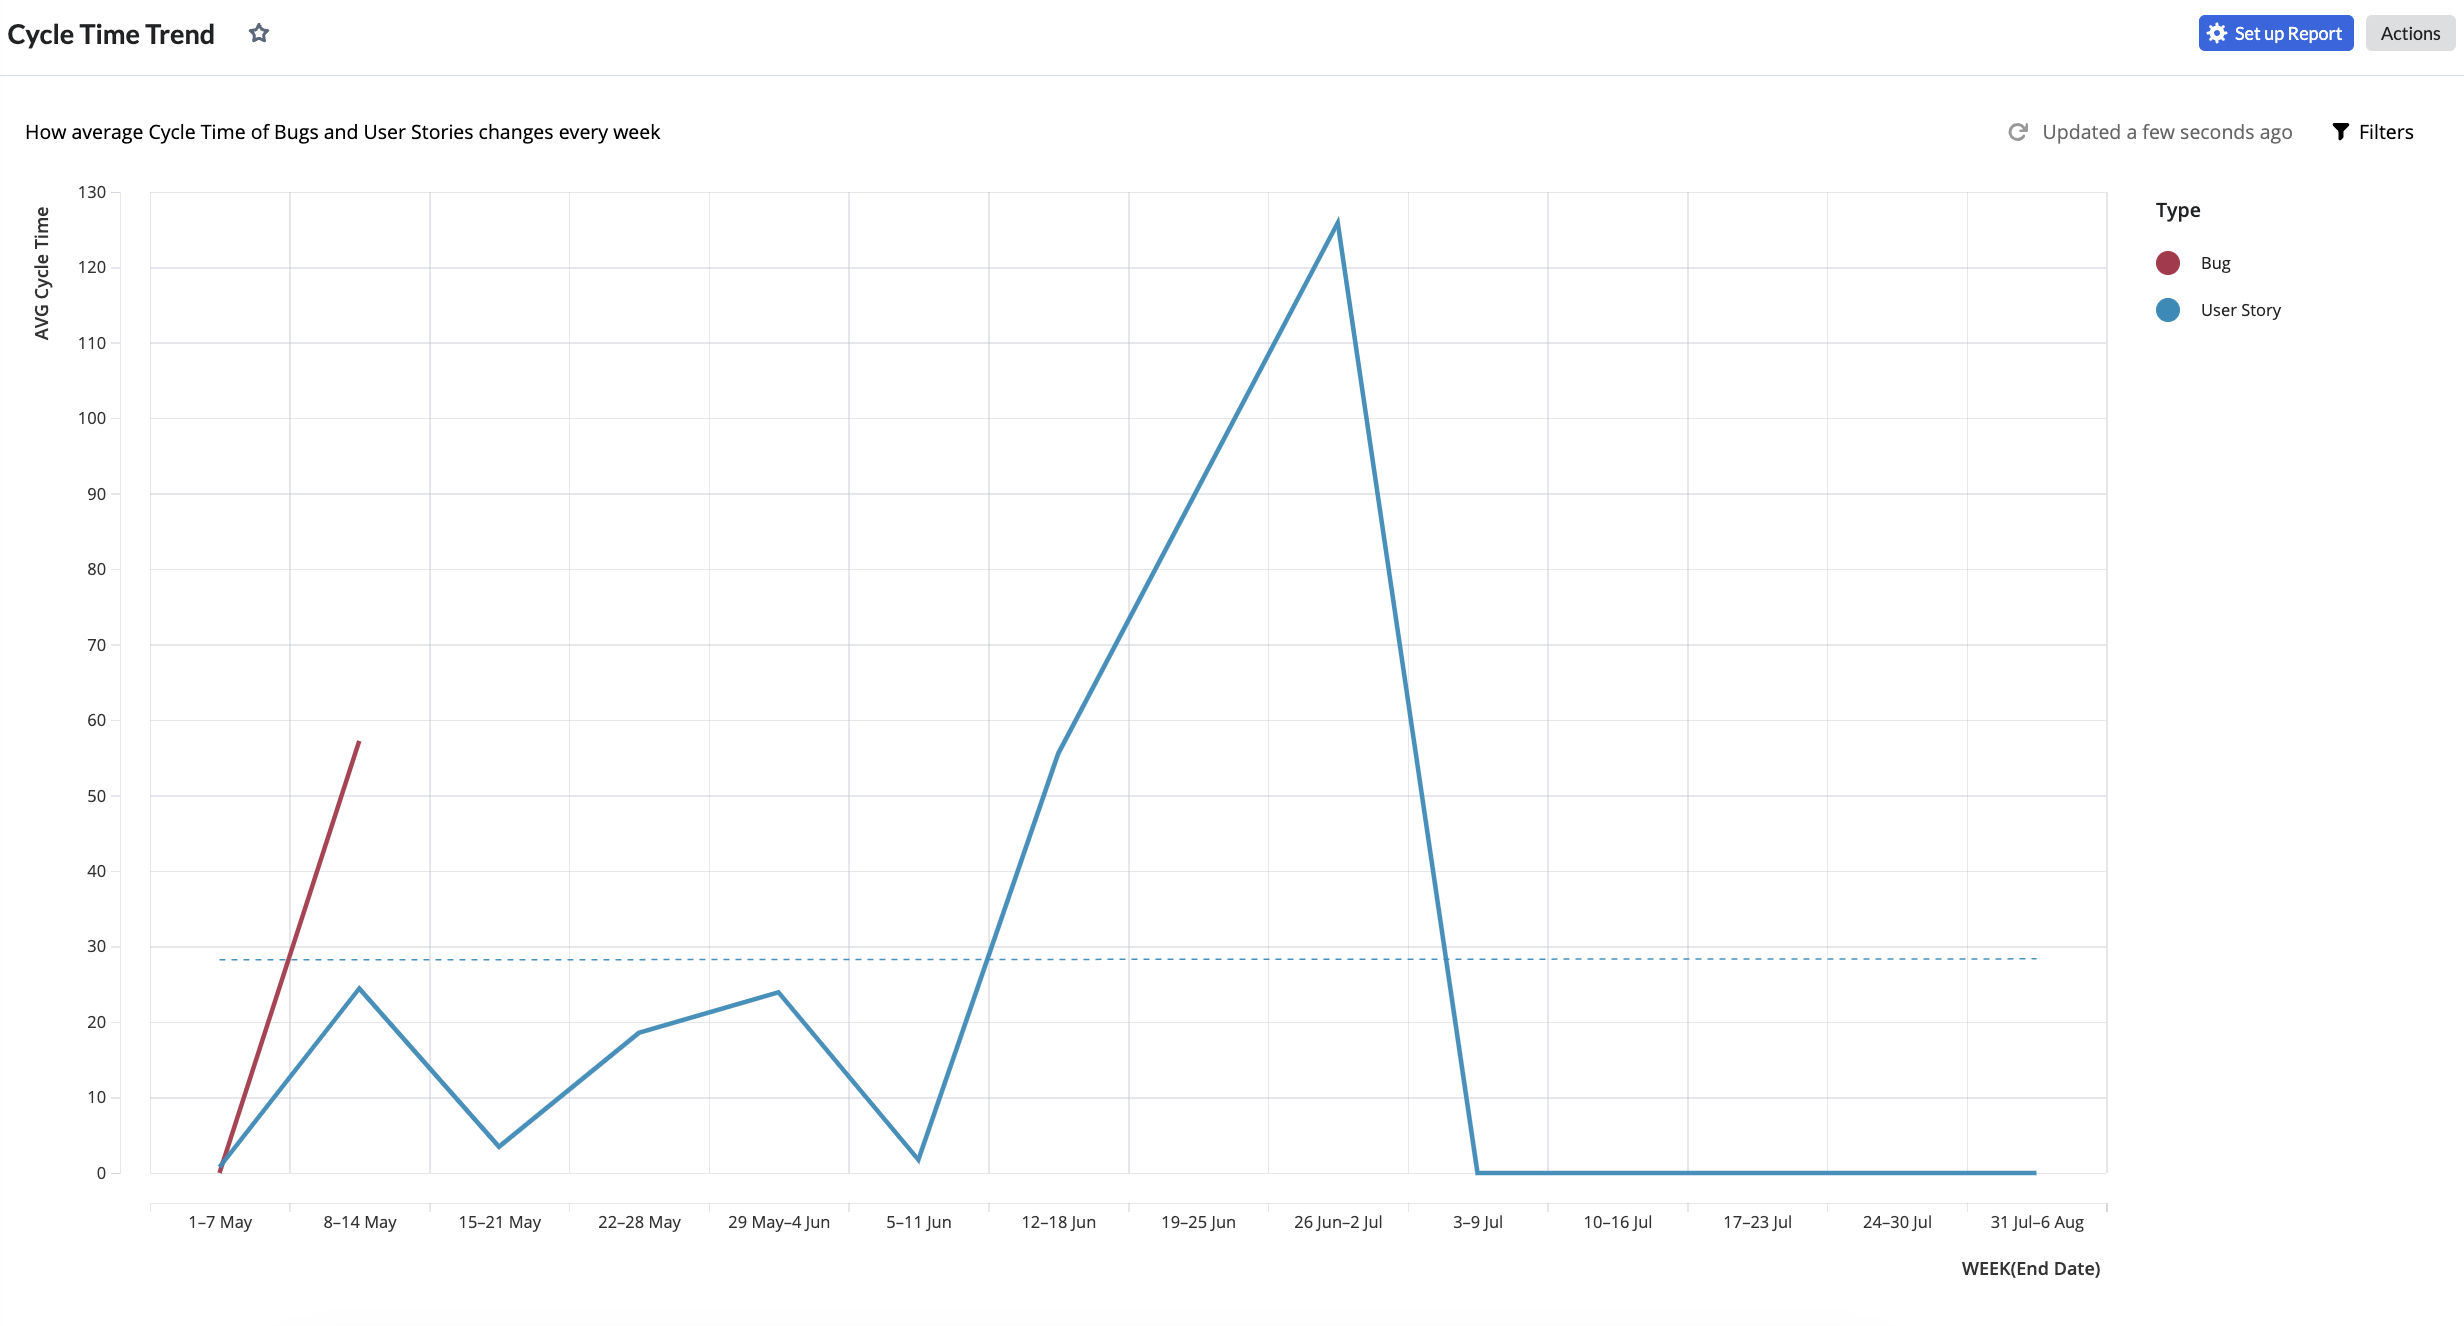
Cycle Time Trend
The Cycle Time Trend view illustrates the historical data of task cycle times, enabling teams to monitor changes in performance over time and make data-driven decisions for process enhancements.
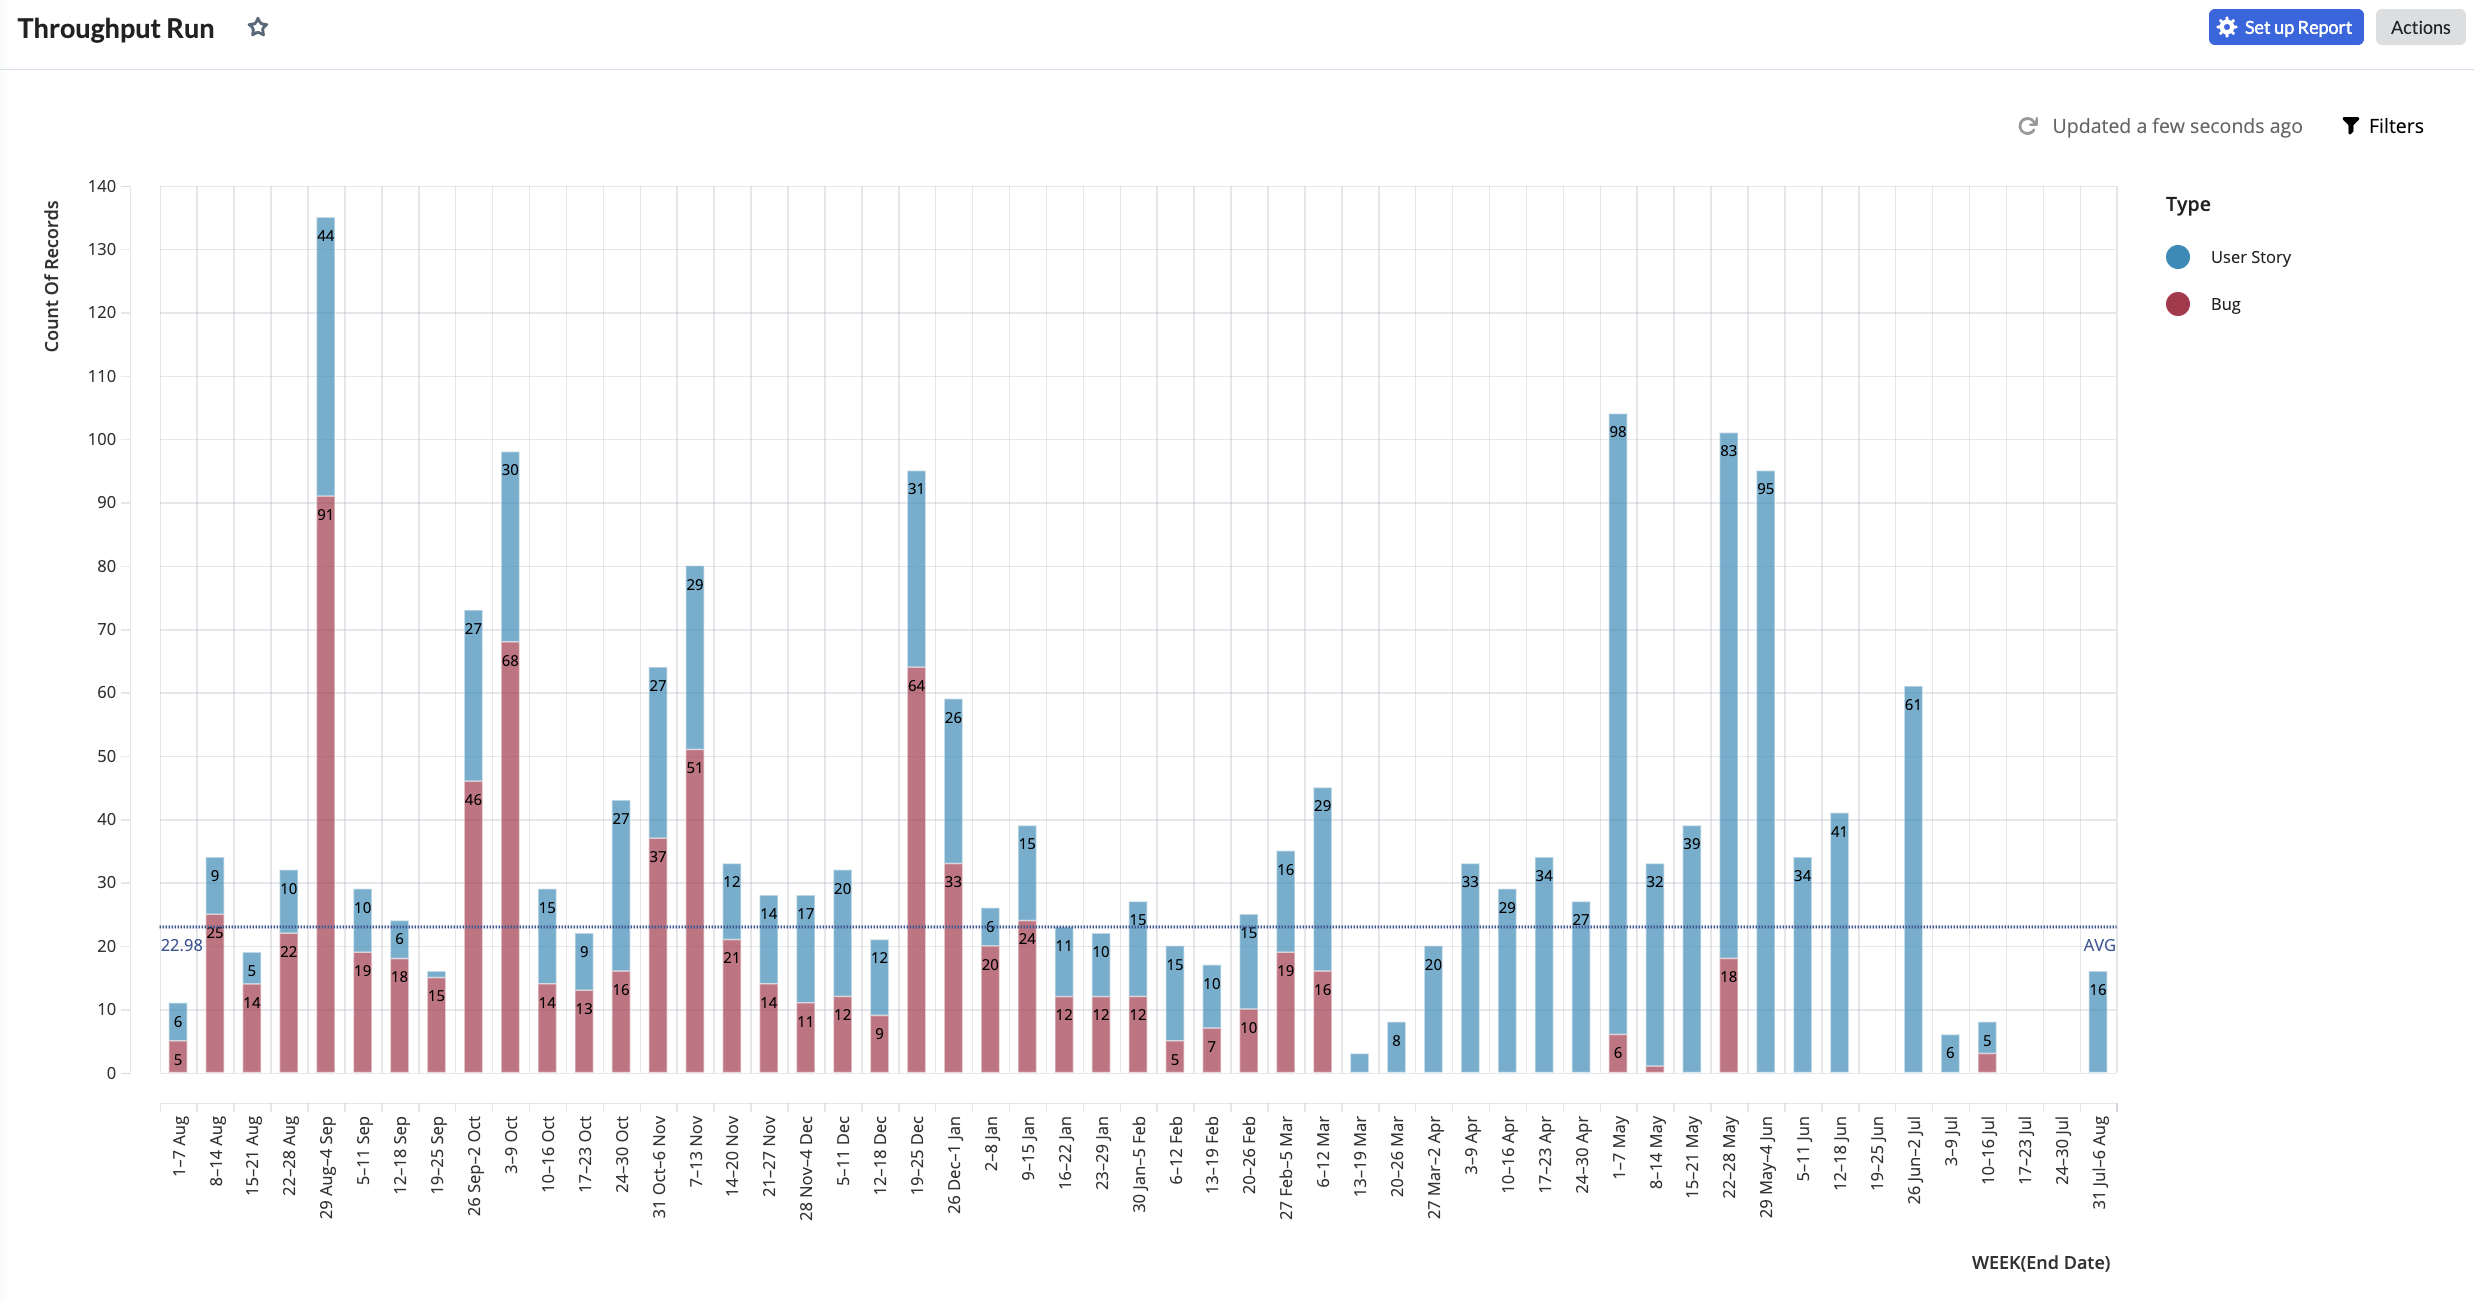
Throughput Run
Throughput Run calculates and displays the number of work items completed within a specific time frame (week by default), providing insights into team productivity and capacity for planning and improvement.
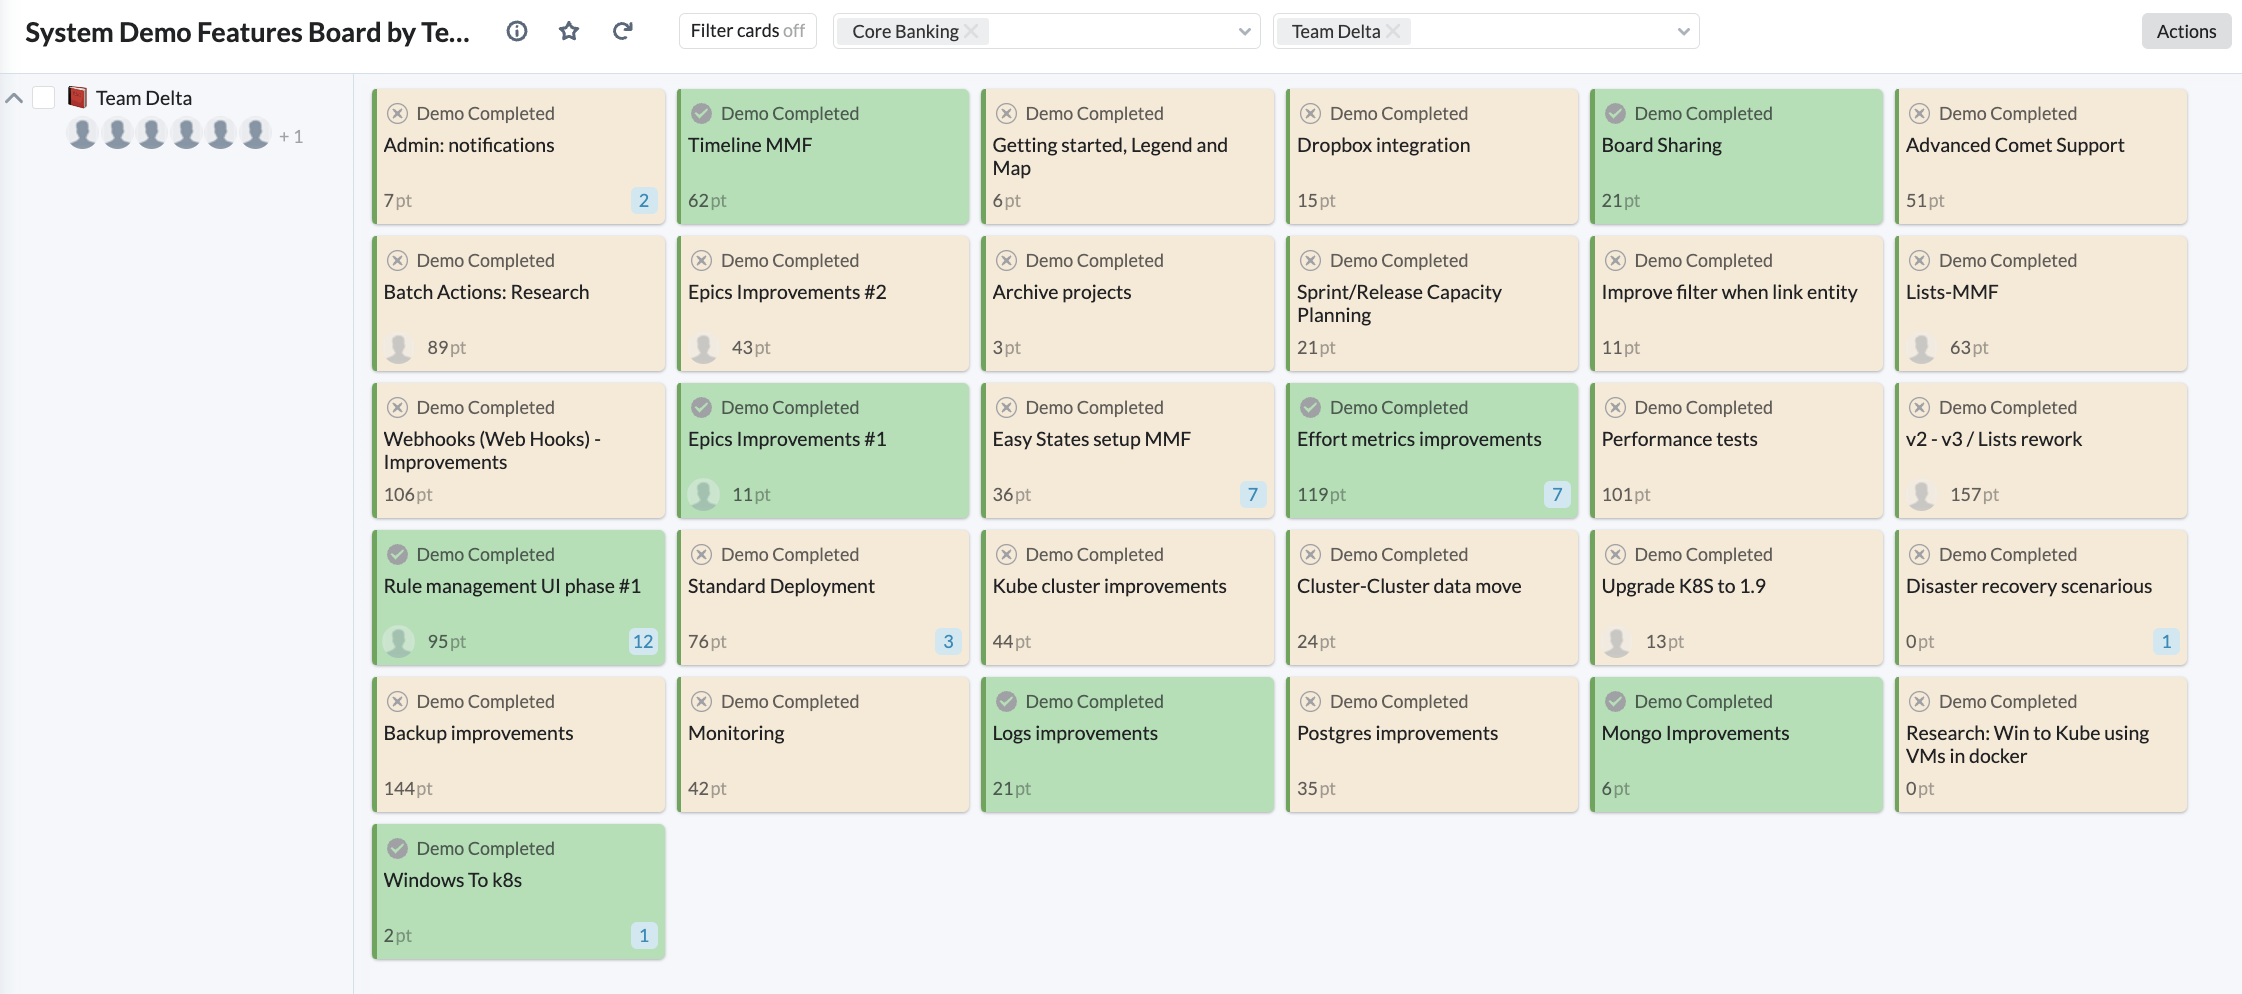
System Demo Features Board by Teams
The team engages in regular Team Syncs and Iteration Reviews to assess progress and adapt as needed. Participation in the System Demo provides stakeholders with an integrated view of new Features, and tracking progress using a Kanban board helps ensure steady delivery of work items throughout the iteration.
During the System Demo, all teams within the Agile Release Train (ART) present an integrated view of new Features delivered in the most recent iteration, allowing ART stakeholders to objectively assess the progress made during the Planning Interval (PI), with active participation or attendance from everyone involved in the ART. The Demo Completed checkbox on a Feature provides visibility into which Features have already undergone a demonstration.
-------------------
Version 1.0
Still have a question?
We're here to help! Just contact our friendly support team
Find out more about our APIs, Plugins, Mashups and custom extensions. Join our community of passionate users and even discuss directly with our developers.