6 years ago
Select and create Tasks under Feature lanes
In this release we’ve introduced the ability to add Tasks in List view via quick add when Feature or User Story are selected as a lane.
Visual Reports: New functions in calculations
There are some new functions available in calculations: DATEPART and DATENAME.
- DATEPART([field], ‘part’) can be applied to dates only. The function returns a specified part of a given date, as an integer value.
Possible parts are minute, hour, dayofweek, isodayofweek, dayofmonth, dayofyear, week, month, quarter, year. Example:
DATEPART(DATE('31-Mar-2018'),'month') ----> 3
- DATENAME([field], ‘part’) can be applied to dates only. The function returns a specified part of a given date, as a string value.
Possible parts are minute, hour, dayofweek, dayofmonth, dayofyear, week, month, quarter, year. Example:
DATENAME(DATE('31-Mar-2018'), ‘dayofweek’) ----> ‘Saturday’
Let’s say you built a new requests trend chart for the last 2 years and you want to compare the number of requests over the years for the same period of time (for example for the same month).
Below is initial chart.
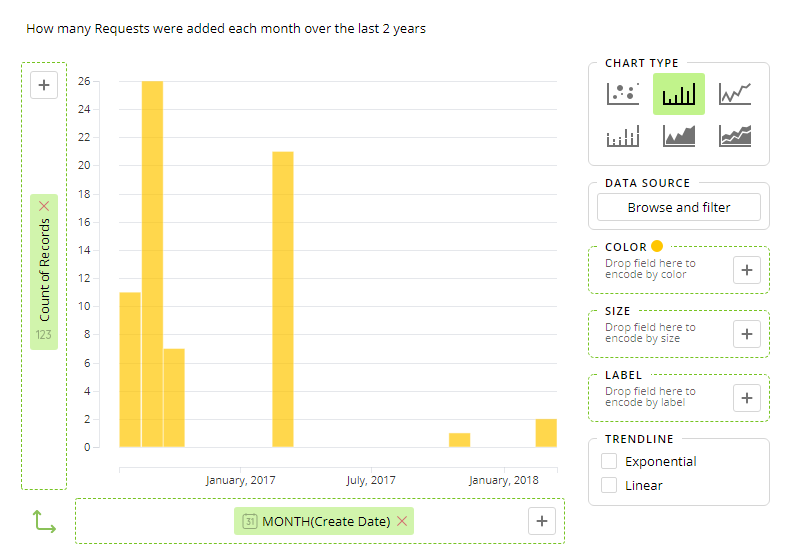
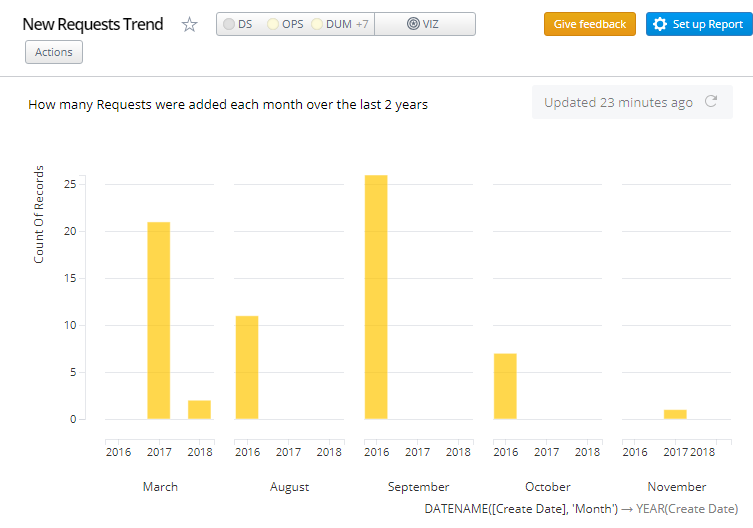
To make the comparison easier to visualize, we recommend displaying the compared periods side by side. To do this, you would need to add the following calculations to the X axis:
DATENAME([Create Date], 'month')
YEAR([Create Date])
Visual Reports: New post aggregation filters
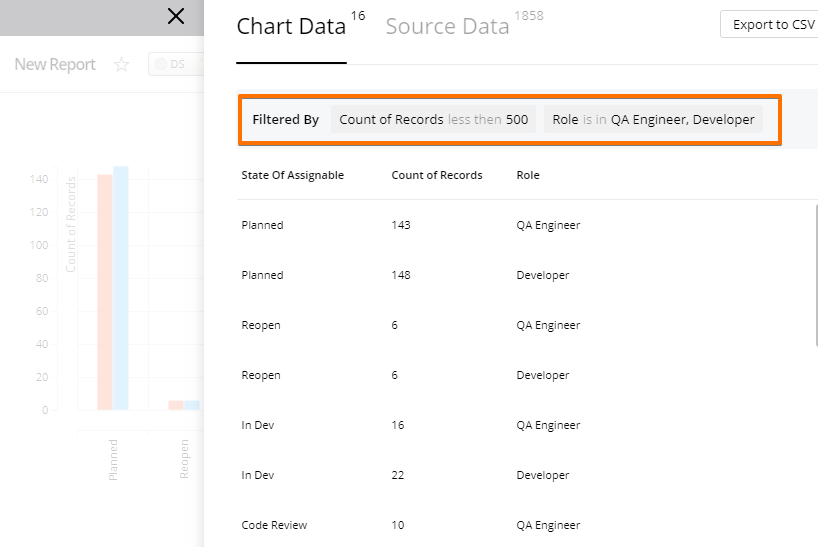
We have added the ability to filter out chart data by having top N or bottom N records. To apply these post aggregation filters you will need to open your chart in edit mode and click the “Browse and Filter” button, “Chart data” tab.
Let’s say you have chart with completed effort by user for any current Release and you need to filter out the 3 users with the highest performance.
Below is initial chart.
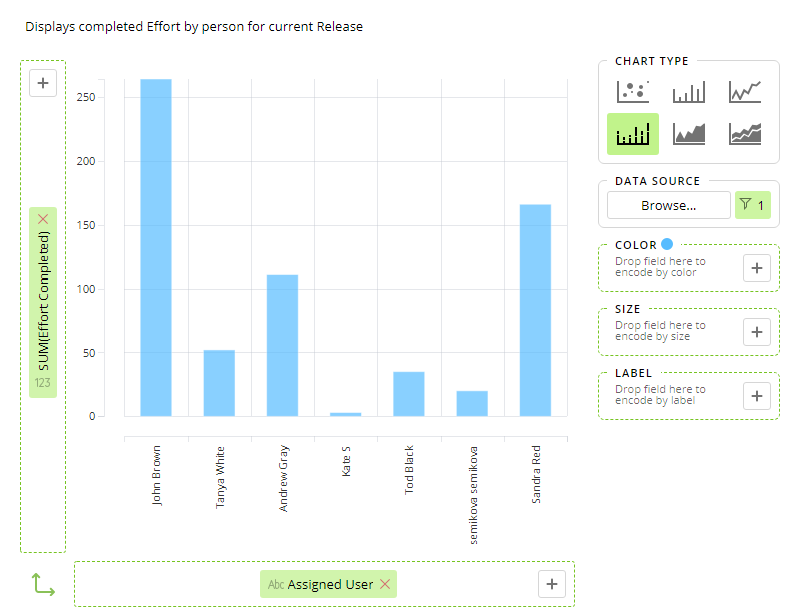
To filter chart aggregated data try the following steps:
Visual Reports: Filters redesign
The look and feel of applied filters has changed, we hope you will like these changes as the interface has become more compact and user-friendly.
Visual Reports: Advanced filters for Entity Reports
You may now apply advanced filters by type for entities' source (previously it was available only for cumulative and history reports).
Let’s suppose you have a chart that shows Team Effort per Release and you want to exclude User Stories linked to Features to prevent redundant effort values.
Below is the initial chart.
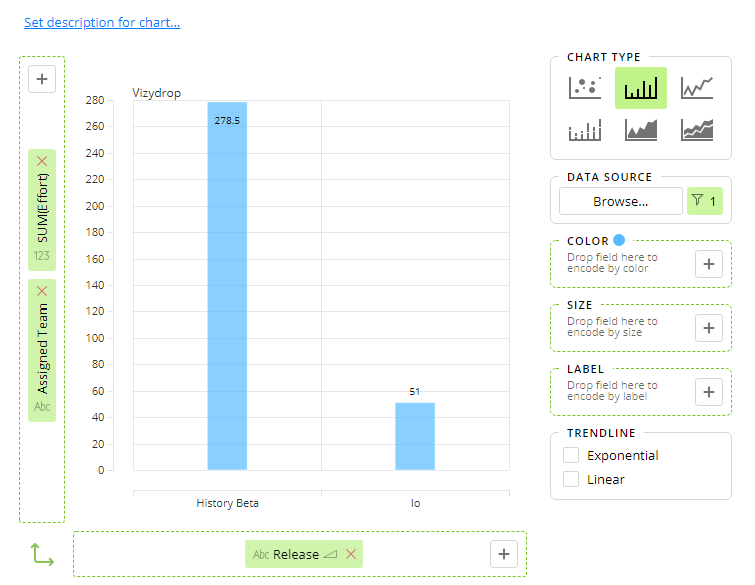
To exclude duplicated effort try the following steps:
Fixed Bugs:
- Search by ID didn't work in Internet Explorer 11
- An error was shown if Project that was selected in context was deleted or access was lost to this Project
- Attachments on replies from the MacOS Mail application were not added as comments to the original request
- Auto focus on search disappeared for the Project dropdown
- Custom formulas were not recalculated if they depended on custom fields from inbound/outbound relations
- Historical Visual reports became broken when a formula with reference to Entity Custom Fields was added to data fields
- Service Desk settings page UI looked weird
- Visual Reports: fixed an error on create and view reports in Internet Explorer 11
- Visual Reports: fixed an error on applying Min or Max aggregation to Timeline
Add comment